29
/it/
it
AIzaSyAYiBZKx7MnpbEhh9jyipgxe19OcubqV5w
April 1, 2024
117317
Cyprus
CYP
true
2
1
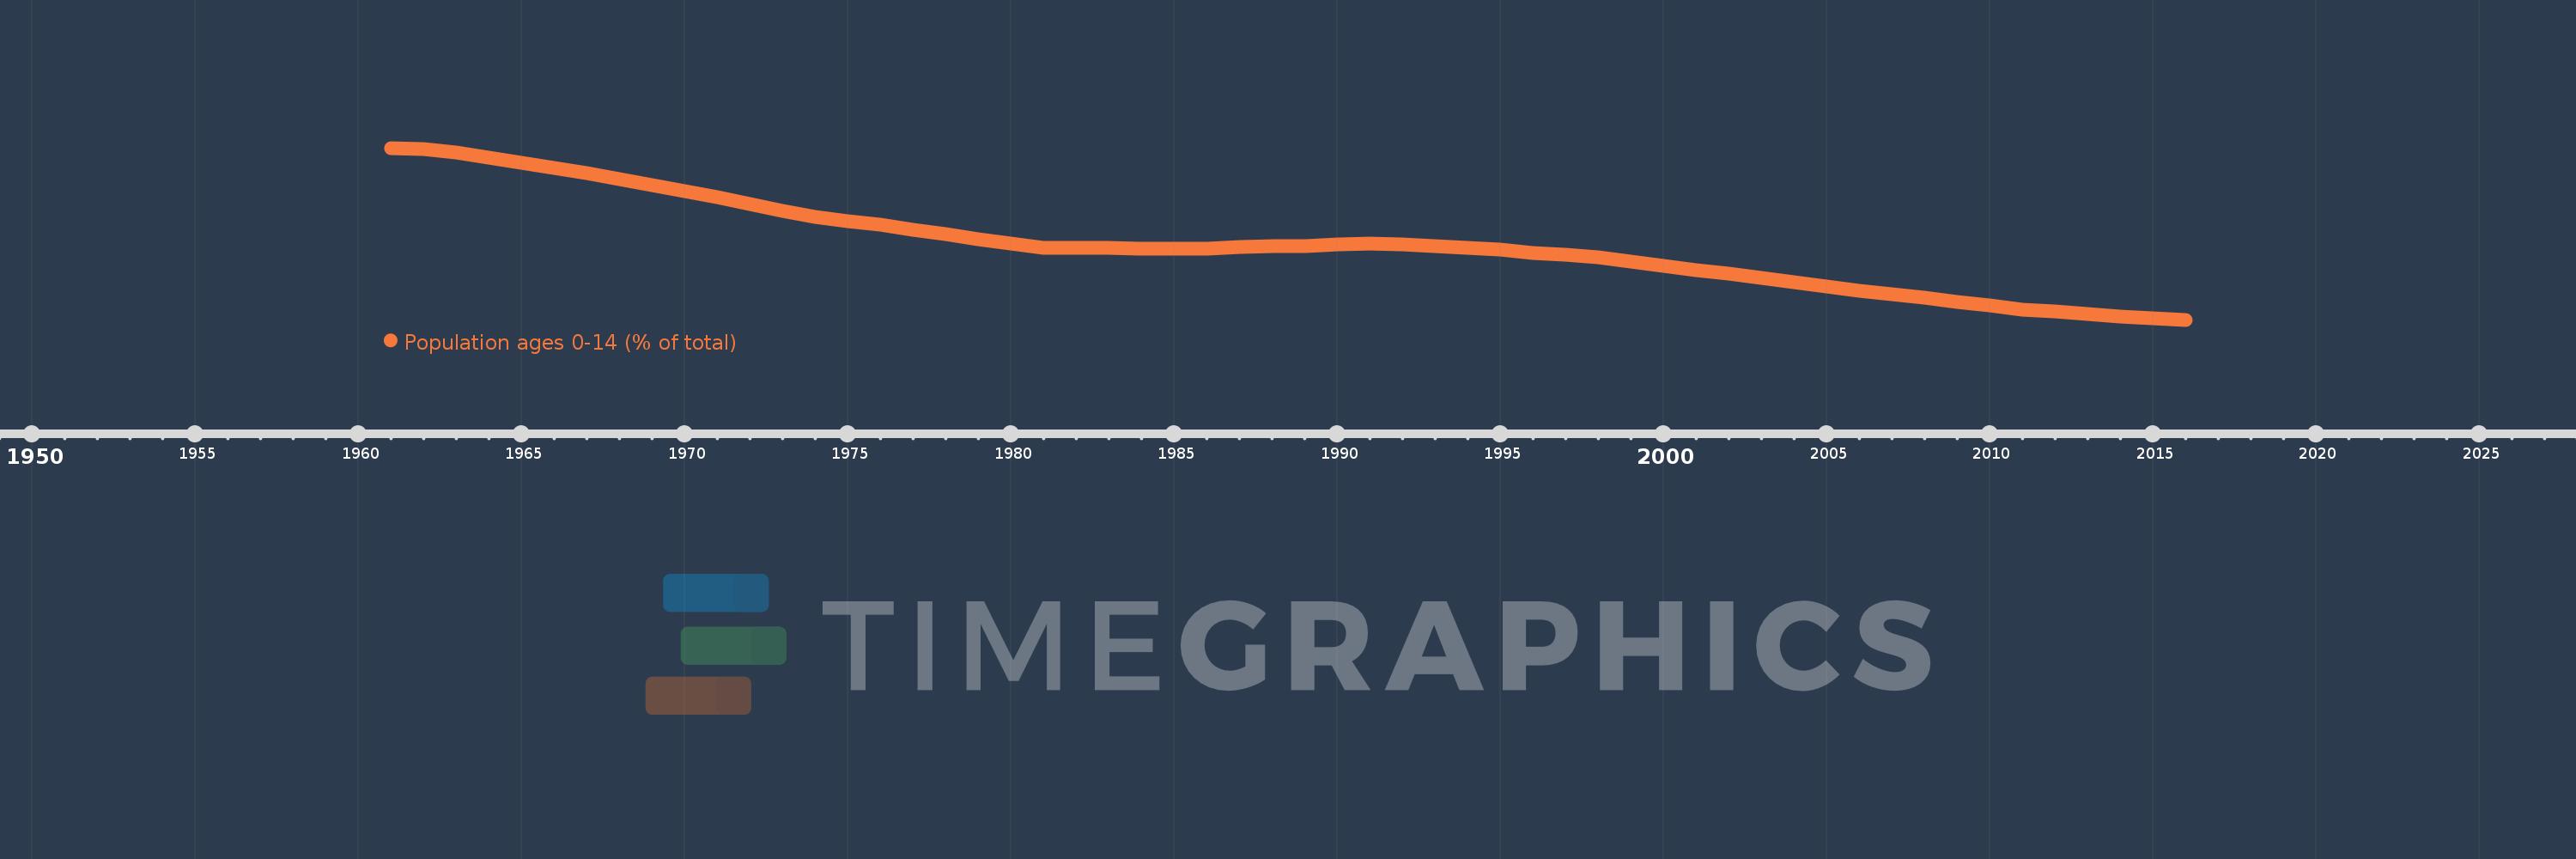
Population ages 0-14 (% of total)
2016,2015,2014,2013,2012,2011,2010,2009,2008,2007,2006,2005,2004,2003,2002,2001,2000,1999,1998,1997,1996,1995,1994,1993,1992,1991,1990,1989,1988,1987,1986,1985,1984,1983,1982,1981,1980,1979,1978,1977,1976,1975,1974,1973,1972,1971,1970,1969,1968,1967,1966,1965,1964,1963,1962,1961
Queste statistiche in altri paesi:
AfghanistanAlbaniaAlgeriaAngolaAntigua and BarbudaArab WorldArgentinaArmeniaArubaAustraliaAustriaAzerbaijanBahamas, TheBahrainBangladeshBarbadosBelarusBelgiumBelizeBeninBhutanBoliviaBosnia and HerzegovinaBotswanaBrazilBrunei DarussalamBulgariaBurkina FasoBurundiCabo VerdeCambodiaCameroonCanadaCaribbean small statesCentral African RepublicCentral Europe and the BalticsChadChannel IslandsChileChinaColombiaComorosCongo, Dem. Rep.Congo, Rep.Costa RicaCote d'IvoireCroatiaCubaCuracaoCyprusCzech RepublicDenmarkDjiboutiDominican RepublicEarly-demographic dividendEast Asia & PacificEast Asia & Pacific (excluding high income)East Asia & Pacific (IDA & IBRD countries)EcuadorEgypt, Arab Rep.El SalvadorEquatorial GuineaEritreaEstoniaEthiopiaEuro areaEurope & Central AsiaEurope & Central Asia (excluding high income)Europe & Central Asia (IDA & IBRD countries)European UnionFijiFinlandFragile and conflict affected situationsFranceFrench PolynesiaGabonGambia, TheGeorgiaGermanyGhanaGreeceGrenadaGuamGuatemalaGuineaGuinea-BissauGuyanaHaitiHeavily indebted poor countries (HIPC)High incomeHondurasHong Kong SAR, ChinaHungaryIBRD onlyIcelandIDA & IBRD totalIDA blendIDA onlyIDA totalIndiaIndonesiaIran, Islamic Rep.IraqIrelandIsraelItalyJamaicaJapanJordanKazakhstanKenyaKiribatiKorea, Dem. People’s Rep.Korea, Rep.KosovoKuwaitKyrgyz RepublicLao PDRLate-demographic dividendLatin America & Caribbean Latin America & Caribbean (excluding high income)Latin America & the Caribbean (IDA & IBRD countries)LatviaLeast developed countries: UN classificationLebanonLesothoLiberiaLibyaLithuaniaLow & middle incomeLow incomeLower middle incomeLuxembourgMacao SAR, ChinaMacedonia, FYRMadagascarMalawiMalaysiaMaldivesMaliMaltaMauritaniaMauritiusMexicoMicronesia, Fed. Sts.Middle East & North AfricaMiddle East & North Africa (excluding high income)Middle East & North Africa (IDA & IBRD countries)Middle incomeMoldovaMongoliaMontenegroMoroccoMozambiqueMyanmarNamibiaNepalNetherlandsNew CaledoniaNew ZealandNicaraguaNigerNigeriaNorth AmericaNorwayOECD membersOmanOther small statesPacific island small statesPakistanPanamaPapua New GuineaParaguayPeruPhilippinesPolandPortugalPost-demographic dividendPre-demographic dividendPuerto RicoQatarRomaniaRussian FederationRwandaSamoaSao Tome and PrincipeSaudi ArabiaSenegalSerbiaSeychellesSierra LeoneSingaporeSlovak RepublicSloveniaSmall statesSolomon IslandsSomaliaSouth AfricaSouth AsiaSouth Asia (IDA & IBRD)South SudanSpainSri LankaSt. LuciaSt. Vincent and the GrenadinesSub-Saharan Africa Sub-Saharan Africa (excluding high income)Sub-Saharan Africa (IDA & IBRD countries)SudanSurinameSwazilandSwedenSwitzerlandSyrian Arab RepublicTajikistanTanzaniaThailandTimor-LesteTogoTongaTrinidad and TobagoTunisiaTurkeyTurkmenistanUgandaUkraineUnited Arab EmiratesUnited KingdomUnited StatesUpper middle incomeUruguayUzbekistanVanuatuVenezuela, RBVietnamVirgin Islands (U.S.)West Bank and GazaWorldYemen, Rep.ZambiaZimbabwe Linea del tempo:
Questa scala temporale mostra un grafico dal 1961 anno al 2016 anno. Cyprus. I dati fino ad 1960 anno non disponibili. Il numero di osservazioni attuali secondo i date: 56.
La fonte (nome):
Indicatori dello sviluppo mondiale
La fonte (organizzazione):
World Bank staff estimates based on age distributions of United Nations Population Division's World Population Prospects.
Categorie:
Education, Health
sono stati aggiornati
23 apr 2017 anni
Indicatori delle variazioni dei valori per anni
Minima:
16.551
1 gen 2016 anni
Massimo:
36.708
1 gen 1961 anni
Alla data di osservazione
Valore
Variazione assoluta
La variazione rispetto al valore precedente
1 gen 1961 anni
36.708
+36.708
0.0%
1 gen 1962 anni
36.587
-0.121
-0.33%
1 gen 1963 anni
36.191
-0.396
-1.08%
1 gen 1964 anni
35.604
-0.586
-1.62%
1 gen 1965 anni
34.968
-0.637
-1.79%
1 gen 1966 anni
34.343
-0.625
-1.79%
1 gen 1967 anni
33.733
-0.61
-1.78%
1 gen 1968 anni
33.058
-0.675
-2.0%
1 gen 1969 anni
32.357
-0.701
-2.12%
1 gen 1970 anni
31.653
-0.704
-2.17%
1 gen 1971 anni
30.96
-0.694
-2.19%
1 gen 1972 anni
30.11
-0.85
-2.75%
1 gen 1973 anni
29.298
-0.811
-2.69%
1 gen 1974 anni
28.633
-0.665
-2.27%
1 gen 1975 anni
28.127
-0.506
-1.77%
1 gen 1976 anni
27.711
-0.416
-1.48%
1 gen 1977 anni
27.146
-0.565
-2.04%
1 gen 1978 anni
26.578
-0.568
-2.09%
1 gen 1979 anni
26.031
-0.547
-2.06%
1 gen 1980 anni
25.504
-0.527
-2.02%
1 gen 1981 anni
24.991
-0.513
-2.01%
1 gen 1982 anni
25.003
+0.011
0.05%
1 gen 1983 anni
24.965
-0.037
-0.15%
1 gen 1984 anni
24.932
-0.034
-0.13%
1 gen 1985 anni
24.921
-0.011
-0.04%
1 gen 1986 anni
24.932
+0.011
0.04%
1 gen 1987 anni
25.081
+0.149
0.6%
1 gen 1988 anni
25.141
+0.06
0.24%
1 gen 1989 anni
25.215
+0.074
0.3%
1 gen 1990 anni
25.344
+0.128
0.51%
1 gen 1991 anni
25.49
+0.147
0.58%
1 gen 1992 anni
25.354
-0.137
-0.54%
1 gen 1993 anni
25.191
-0.163
-0.64%
1 gen 1994 anni
24.999
-0.192
-0.76%
1 gen 1995 anni
24.739
-0.26
-1.04%
1 gen 1996 anni
24.393
-0.347
-1.4%
1 gen 1997 anni
24.217
-0.176
-0.72%
1 gen 1998 anni
23.857
-0.36
-1.49%
1 gen 1999 anni
23.393
-0.464
-1.94%
1 gen 2000 anni
22.898
-0.495
-2.12%
1 gen 2001 anni
22.4
-0.498
-2.18%
1 gen 2002 anni
21.913
-0.487
-2.17%
1 gen 2003 anni
21.427
-0.486
-2.22%
1 gen 2004 anni
20.954
-0.473
-2.21%
1 gen 2005 anni
20.471
-0.483
-2.3%
1 gen 2006 anni
19.963
-0.508
-2.48%
1 gen 2007 anni
19.563
-0.4
-2.0%
1 gen 2008 anni
19.134
-0.429
-2.2%
1 gen 2009 anni
18.683
-0.451
-2.36%
1 gen 2010 anni
18.223
-0.46
-2.46%
1 gen 2011 anni
17.769
-0.454
-2.49%
1 gen 2012 anni
17.509
-0.26
-1.46%
1 gen 2013 anni
17.233
-0.275
-1.57%
1 gen 2014 anni
16.973
-0.26
-1.51%
1 gen 2015 anni
16.747
-0.227
-1.34%
1 gen 2016 anni
16.551
-0.196
-1.17%
Classificazione dei paesi secondo i statistiche attuali per anni


Commenti: