29
/it/
it
AIzaSyAYiBZKx7MnpbEhh9jyipgxe19OcubqV5w
April 1, 2024
226296
Portugal
PRT
true
2
1
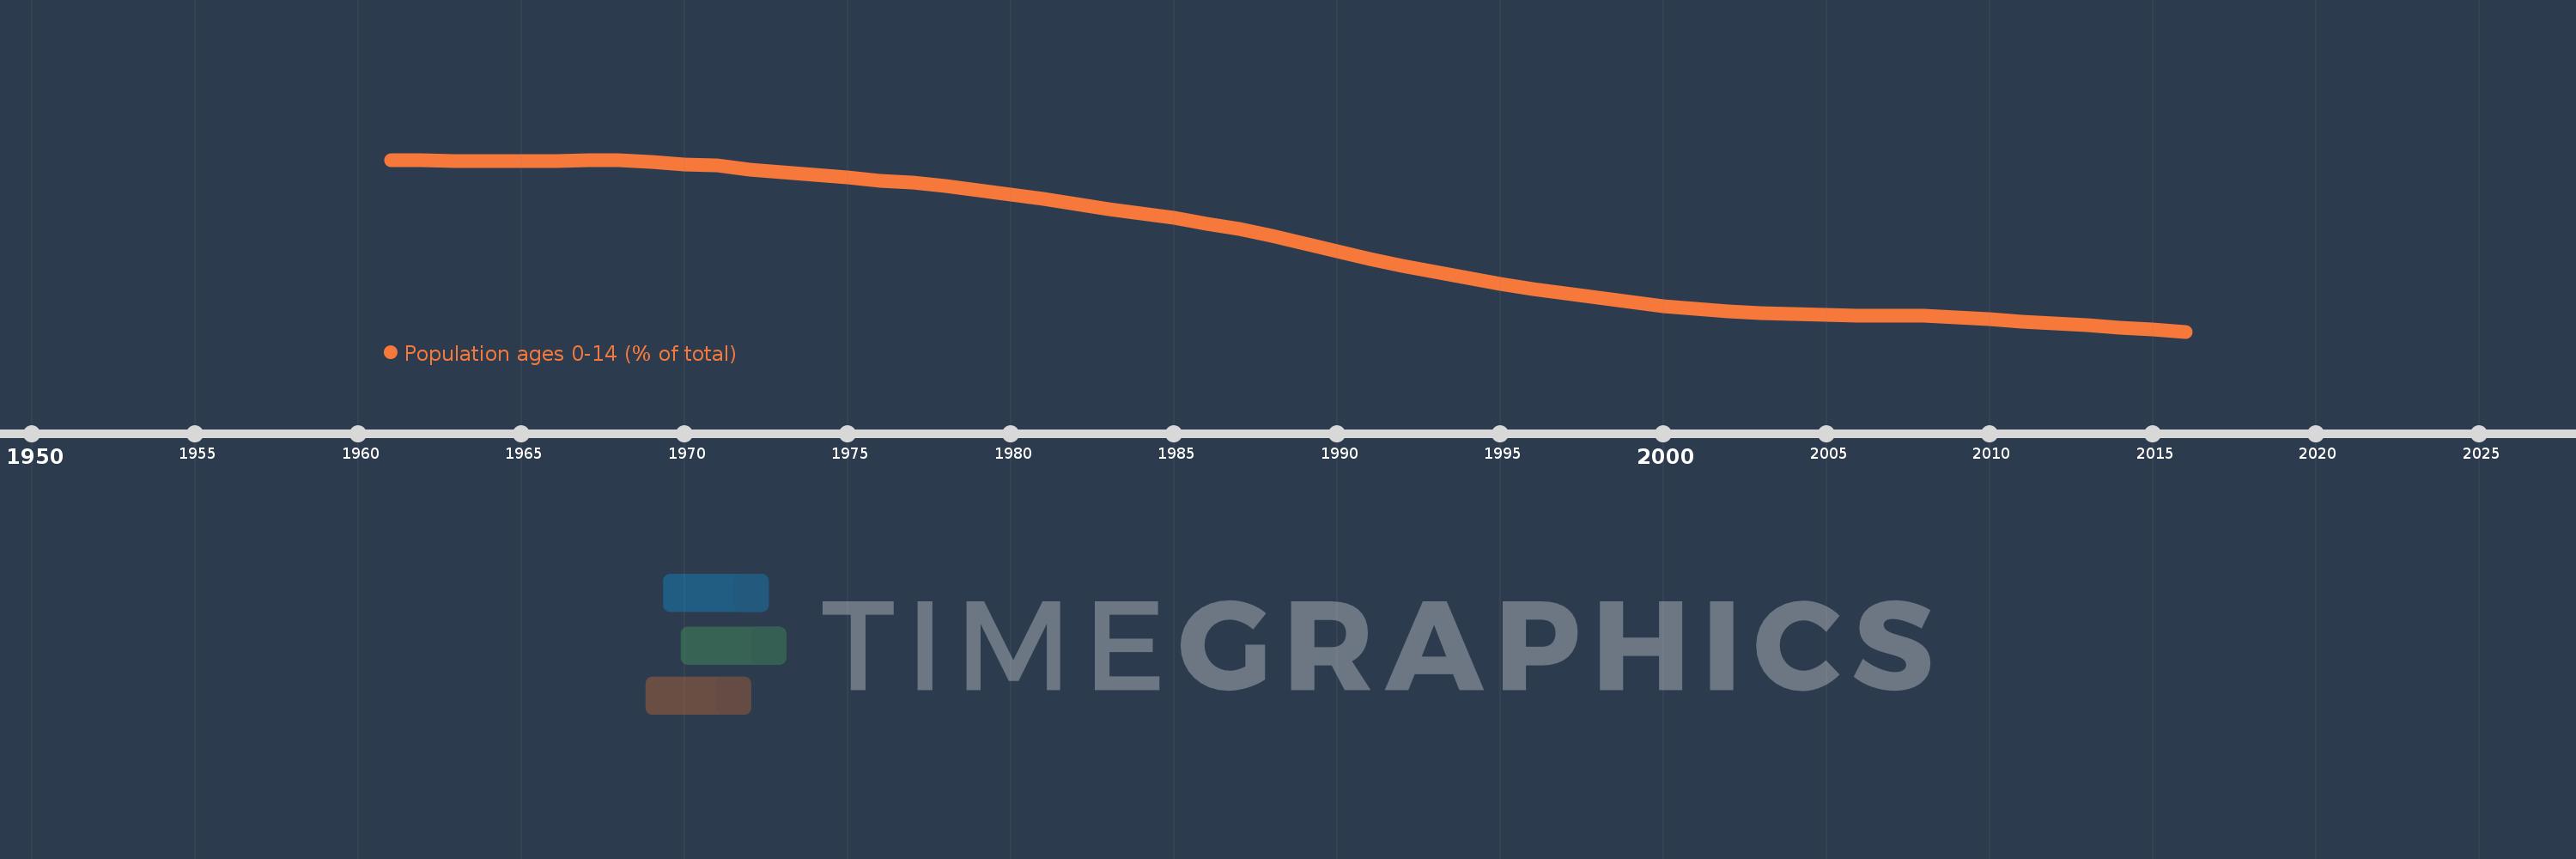
Population ages 0-14 (% of total)
2016,2015,2014,2013,2012,2011,2010,2009,2008,2007,2006,2005,2004,2003,2002,2001,2000,1999,1998,1997,1996,1995,1994,1993,1992,1991,1990,1989,1988,1987,1986,1985,1984,1983,1982,1981,1980,1979,1978,1977,1976,1975,1974,1973,1972,1971,1970,1969,1968,1967,1966,1965,1964,1963,1962,1961
Queste statistiche in altri paesi:
AfghanistanAlbaniaAlgeriaAngolaAntigua and BarbudaArab WorldArgentinaArmeniaArubaAustraliaAustriaAzerbaijanBahamas, TheBahrainBangladeshBarbadosBelarusBelgiumBelizeBeninBhutanBoliviaBosnia and HerzegovinaBotswanaBrazilBrunei DarussalamBulgariaBurkina FasoBurundiCabo VerdeCambodiaCameroonCanadaCaribbean small statesCentral African RepublicCentral Europe and the BalticsChadChannel IslandsChileChinaColombiaComorosCongo, Dem. Rep.Congo, Rep.Costa RicaCote d'IvoireCroatiaCubaCuracaoCyprusCzech RepublicDenmarkDjiboutiDominican RepublicEarly-demographic dividendEast Asia & PacificEast Asia & Pacific (excluding high income)East Asia & Pacific (IDA & IBRD countries)EcuadorEgypt, Arab Rep.El SalvadorEquatorial GuineaEritreaEstoniaEthiopiaEuro areaEurope & Central AsiaEurope & Central Asia (excluding high income)Europe & Central Asia (IDA & IBRD countries)European UnionFijiFinlandFragile and conflict affected situationsFranceFrench PolynesiaGabonGambia, TheGeorgiaGermanyGhanaGreeceGrenadaGuamGuatemalaGuineaGuinea-BissauGuyanaHaitiHeavily indebted poor countries (HIPC)High incomeHondurasHong Kong SAR, ChinaHungaryIBRD onlyIcelandIDA & IBRD totalIDA blendIDA onlyIDA totalIndiaIndonesiaIran, Islamic Rep.IraqIrelandIsraelItalyJamaicaJapanJordanKazakhstanKenyaKiribatiKorea, Dem. People’s Rep.Korea, Rep.KosovoKuwaitKyrgyz RepublicLao PDRLate-demographic dividendLatin America & Caribbean Latin America & Caribbean (excluding high income)Latin America & the Caribbean (IDA & IBRD countries)LatviaLeast developed countries: UN classificationLebanonLesothoLiberiaLibyaLithuaniaLow & middle incomeLow incomeLower middle incomeLuxembourgMacao SAR, ChinaMacedonia, FYRMadagascarMalawiMalaysiaMaldivesMaliMaltaMauritaniaMauritiusMexicoMicronesia, Fed. Sts.Middle East & North AfricaMiddle East & North Africa (excluding high income)Middle East & North Africa (IDA & IBRD countries)Middle incomeMoldovaMongoliaMontenegroMoroccoMozambiqueMyanmarNamibiaNepalNetherlandsNew CaledoniaNew ZealandNicaraguaNigerNigeriaNorth AmericaNorwayOECD membersOmanOther small statesPacific island small statesPakistanPanamaPapua New GuineaParaguayPeruPhilippinesPolandPortugalPost-demographic dividendPre-demographic dividendPuerto RicoQatarRomaniaRussian FederationRwandaSamoaSao Tome and PrincipeSaudi ArabiaSenegalSerbiaSeychellesSierra LeoneSingaporeSlovak RepublicSloveniaSmall statesSolomon IslandsSomaliaSouth AfricaSouth AsiaSouth Asia (IDA & IBRD)South SudanSpainSri LankaSt. LuciaSt. Vincent and the GrenadinesSub-Saharan Africa Sub-Saharan Africa (excluding high income)Sub-Saharan Africa (IDA & IBRD countries)SudanSurinameSwazilandSwedenSwitzerlandSyrian Arab RepublicTajikistanTanzaniaThailandTimor-LesteTogoTongaTrinidad and TobagoTunisiaTurkeyTurkmenistanUgandaUkraineUnited Arab EmiratesUnited KingdomUnited StatesUpper middle incomeUruguayUzbekistanVanuatuVenezuela, RBVietnamVirgin Islands (U.S.)West Bank and GazaWorldYemen, Rep.ZambiaZimbabwe Linea del tempo:
Questa scala temporale mostra un grafico dal 1961 anno al 2016 anno. Portugal. I dati fino ad 1960 anno non disponibili. Il numero di osservazioni attuali secondo i date: 56.
La fonte (nome):
Indicatori dello sviluppo mondiale
La fonte (organizzazione):
World Bank staff estimates based on age distributions of United Nations Population Division's World Population Prospects.
Categorie:
Education, Health
sono stati aggiornati
23 apr 2017 anni
Indicatori delle variazioni dei valori per anni
Minima:
14.053
1 gen 2016 anni
Massimo:
29.193
1 gen 1961 anni
Alla data di osservazione
Valore
Variazione assoluta
La variazione rispetto al valore precedente
1 gen 1961 anni
29.193
+29.193
0.0%
1 gen 1962 anni
29.125
-0.067
-0.23%
1 gen 1963 anni
29.094
-0.032
-0.11%
1 gen 1964 anni
29.093
0.0
0.0%
1 gen 1965 anni
29.101
+0.008
0.03%
1 gen 1966 anni
29.076
-0.025
-0.09%
1 gen 1967 anni
29.185
+0.11
0.38%
1 gen 1968 anni
29.147
-0.039
-0.13%
1 gen 1969 anni
28.991
-0.155
-0.53%
1 gen 1970 anni
28.811
-0.18
-0.62%
1 gen 1971 anni
28.683
-0.128
-0.44%
1 gen 1972 anni
28.326
-0.357
-1.24%
1 gen 1973 anni
28.061
-0.266
-0.94%
1 gen 1974 anni
27.859
-0.202
-0.72%
1 gen 1975 anni
27.638
-0.221
-0.79%
1 gen 1976 anni
27.348
-0.29
-1.05%
1 gen 1977 anni
27.159
-0.19
-0.69%
1 gen 1978 anni
26.855
-0.303
-1.12%
1 gen 1979 anni
26.477
-0.378
-1.41%
1 gen 1980 anni
26.09
-0.388
-1.46%
1 gen 1981 anni
25.716
-0.374
-1.43%
1 gen 1982 anni
25.274
-0.442
-1.72%
1 gen 1983 anni
24.872
-0.402
-1.59%
1 gen 1984 anni
24.486
-0.386
-1.55%
1 gen 1985 anni
24.068
-0.418
-1.71%
1 gen 1986 anni
23.586
-0.483
-2.01%
1 gen 1987 anni
23.074
-0.512
-2.17%
1 gen 1988 anni
22.491
-0.583
-2.53%
1 gen 1989 anni
21.839
-0.652
-2.9%
1 gen 1990 anni
21.157
-0.682
-3.13%
1 gen 1991 anni
20.486
-0.67
-3.17%
1 gen 1992 anni
19.87
-0.616
-3.01%
1 gen 1993 anni
19.29
-0.58
-2.92%
1 gen 1994 anni
18.753
-0.537
-2.78%
1 gen 1995 anni
18.248
-0.505
-2.69%
1 gen 1996 anni
17.763
-0.485
-2.66%
1 gen 1997 anni
17.409
-0.353
-1.99%
1 gen 1998 anni
17.035
-0.375
-2.15%
1 gen 1999 anni
16.658
-0.377
-2.21%
1 gen 2000 anni
16.317
-0.341
-2.05%
1 gen 2001 anni
16.036
-0.28
-1.72%
1 gen 2002 anni
15.835
-0.201
-1.25%
1 gen 2003 anni
15.699
-0.136
-0.86%
1 gen 2004 anni
15.616
-0.083
-0.53%
1 gen 2005 anni
15.542
-0.074
-0.47%
1 gen 2006 anni
15.439
-0.103
-0.66%
1 gen 2007 anni
15.467
+0.028
0.18%
1 gen 2008 anni
15.427
-0.04
-0.26%
1 gen 2009 anni
15.313
-0.115
-0.74%
1 gen 2010 anni
15.14
-0.172
-1.12%
1 gen 2011 anni
14.932
-0.208
-1.37%
1 gen 2012 anni
14.767
-0.166
-1.11%
1 gen 2013 anni
14.587
-0.179
-1.21%
1 gen 2014 anni
14.408
-0.179
-1.23%
1 gen 2015 anni
14.231
-0.176
-1.22%
1 gen 2016 anni
14.053
-0.178
-1.25%
Classificazione dei paesi secondo i statistiche attuali per anni


Commenti: