29
/fr/
fr
AIzaSyAYiBZKx7MnpbEhh9jyipgxe19OcubqV5w
April 1, 2024
61096
Sub-Saharan Africa (IDA & IBRD countries)
TSS
false
2
1
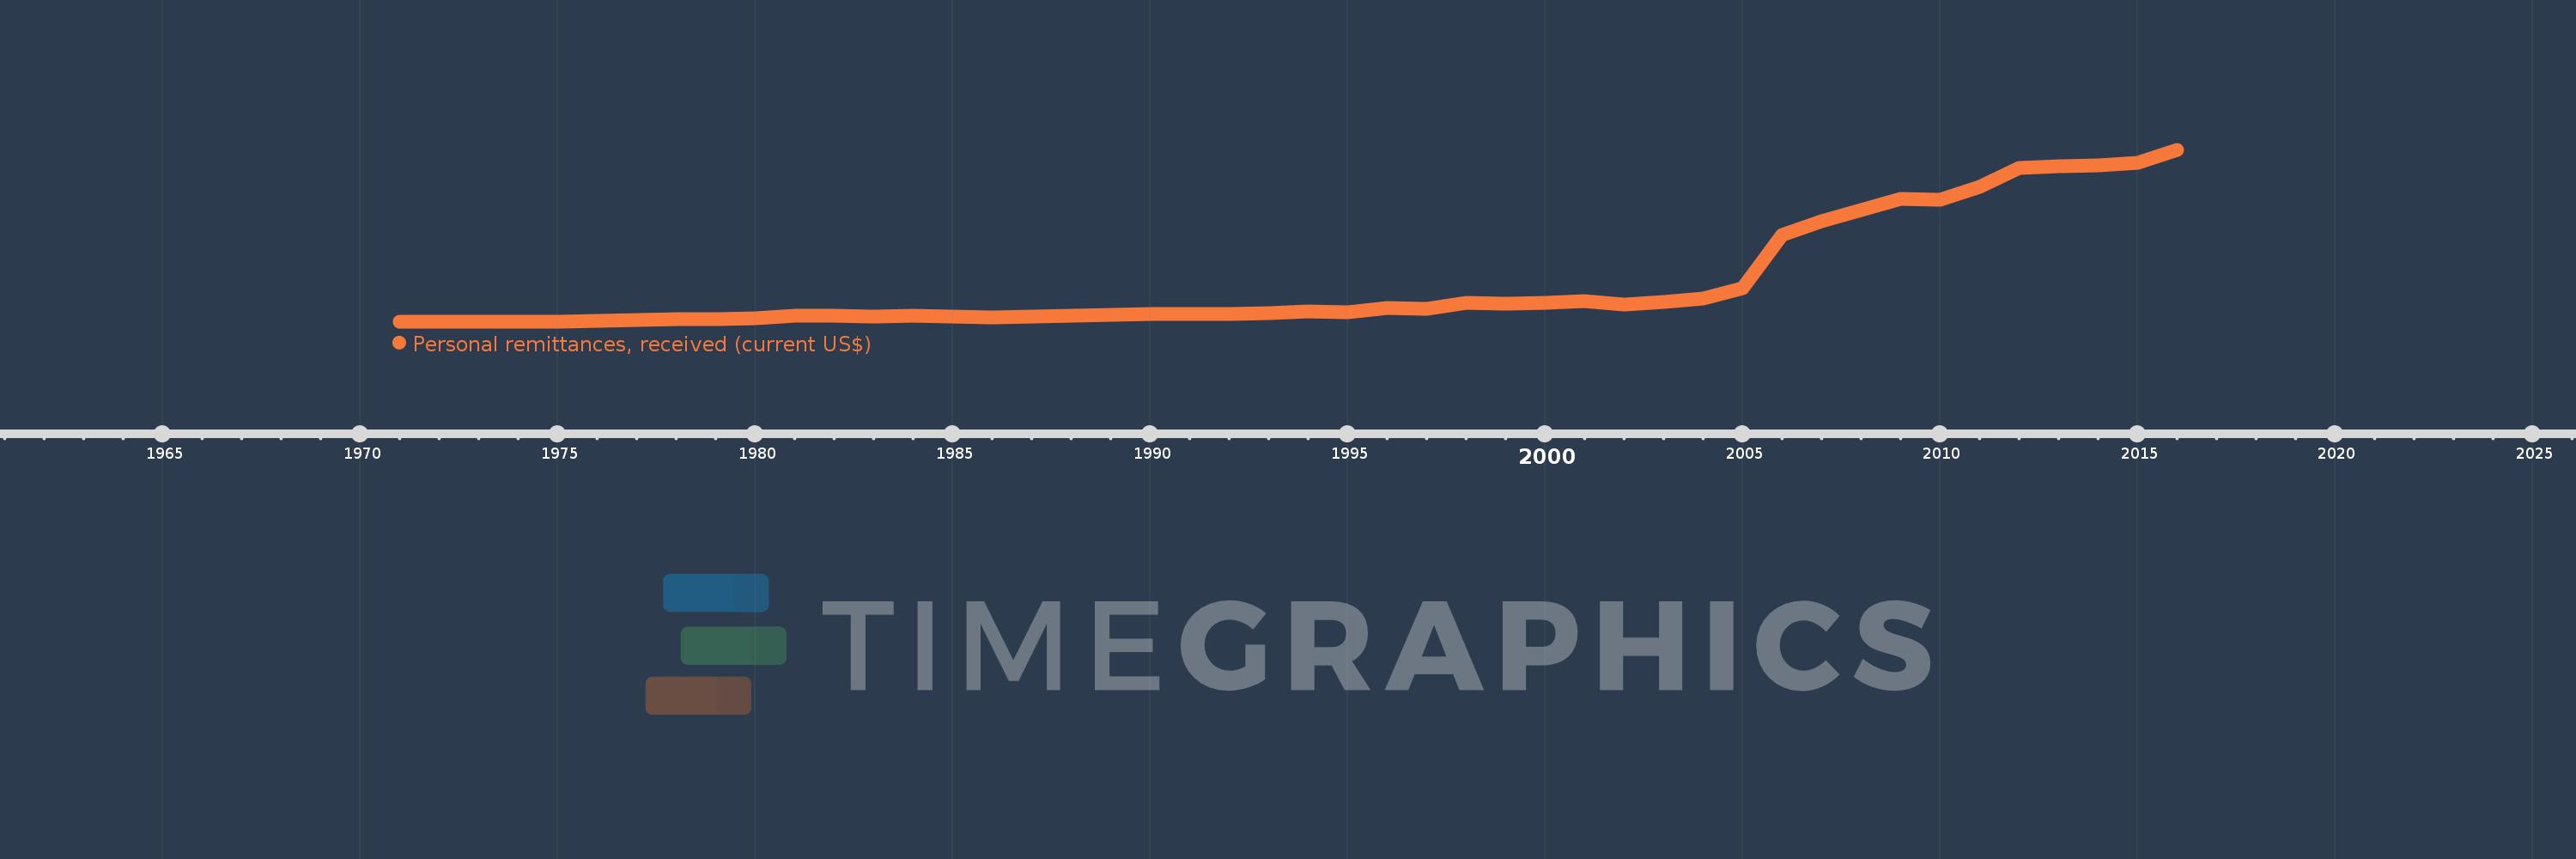
Personal remittances, received (current US$)
2016,2015,2014,2013,2012,2011,2010,2009,2008,2007,2006,2005,2004,2003,2002,2001,2000,1999,1998,1997,1996,1995,1994,1993,1992,1991,1990,1989,1988,1987,1986,1985,1984,1983,1982,1981,1980,1979,1978,1977,1976,1975,1974,1973,1972,1971
Cette statistique dans les autres pays:
AfghanistanAlbaniaAlgeriaAngolaAntigua and BarbudaArab WorldArgentinaArmeniaArubaAustraliaAustriaAzerbaijanBangladeshBarbadosBelarusBelgiumBelizeBeninBermudaBhutanBoliviaBosnia and HerzegovinaBotswanaBrazilBulgariaBurkina FasoBurundiCabo VerdeCambodiaCameroonCanadaCaribbean small statesCentral African RepublicCentral Europe and the BalticsChadChileChinaColombiaComorosCongo, Dem. Rep.Congo, Rep.Costa RicaCote d'IvoireCroatiaCuracaoCyprusCzech RepublicDenmarkDjiboutiDominicaDominican RepublicEarly-demographic dividendEast Asia & PacificEast Asia & Pacific (excluding high income)East Asia & Pacific (IDA & IBRD countries)EcuadorEgypt, Arab Rep.El SalvadorEquatorial GuineaEritreaEstoniaEthiopiaEuro areaEurope & Central AsiaEurope & Central Asia (excluding high income)Europe & Central Asia (IDA & IBRD countries)European UnionFaroe IslandsFijiFinlandFragile and conflict affected situationsFranceFrench PolynesiaGabonGambia, TheGeorgiaGermanyGhanaGreeceGrenadaGuatemalaGuineaGuinea-BissauGuyanaHaitiHeavily indebted poor countries (HIPC)High incomeHondurasHong Kong SAR, ChinaHungaryIBRD onlyIcelandIDA & IBRD totalIDA blendIDA onlyIDA totalIndiaIndonesiaIran, Islamic Rep.IraqIrelandIsraelItalyJamaicaJapanJordanKazakhstanKenyaKiribatiKorea, Rep.KosovoKuwaitKyrgyz RepublicLao PDRLate-demographic dividendLatin America & Caribbean Latin America & Caribbean (excluding high income)Latin America & the Caribbean (IDA & IBRD countries)LatviaLeast developed countries: UN classificationLebanonLesothoLiberiaLibyaLithuaniaLow & middle incomeLow incomeLower middle incomeLuxembourgMacao SAR, ChinaMacedonia, FYRMadagascarMalawiMalaysiaMaldivesMaliMaltaMarshall IslandsMauritaniaMauritiusMexicoMicronesia, Fed. Sts.Middle East & North AfricaMiddle East & North Africa (excluding high income)Middle East & North Africa (IDA & IBRD countries)Middle incomeMoldovaMongoliaMontenegroMoroccoMozambiqueMyanmarNamibiaNepalNetherlandsNew CaledoniaNew ZealandNicaraguaNigerNigeriaNorth AmericaNorwayOECD membersOmanOther small statesPacific island small statesPakistanPalauPanamaPapua New GuineaParaguayPeruPhilippinesPolandPortugalPost-demographic dividendPre-demographic dividendQatarRomaniaRussian FederationRwandaSamoaSao Tome and PrincipeSaudi ArabiaSenegalSerbiaSeychellesSierra LeoneSint Maarten (Dutch part)Slovak RepublicSloveniaSmall statesSolomon IslandsSomaliaSouth AfricaSouth AsiaSouth Asia (IDA & IBRD)South SudanSpainSri LankaSt. Kitts and NevisSt. LuciaSt. Vincent and the GrenadinesSub-Saharan Africa Sub-Saharan Africa (excluding high income)Sub-Saharan Africa (IDA & IBRD countries)SudanSurinameSwazilandSwedenSwitzerlandSyrian Arab RepublicTajikistanTanzaniaThailandTimor-LesteTogoTongaTrinidad and TobagoTunisiaTurkeyTurkmenistanTuvaluUgandaUkraineUnited KingdomUnited StatesUpper middle incomeUruguayUzbekistanVanuatuVenezuela, RBVietnamWest Bank and GazaWorldYemen, Rep.ZambiaZimbabwe La ligne de temps
Cette échelle de temps montre un graphique de 1971 année à 2016 année Sub-Saharan Africa (IDA & IBRD countries). Les données jusqu'à 1970 année ne sont pas présentés. Quantité d'observations actuelles selon dates: 46.
Source (désignation):
Les indicateurs du développement mondiale
Source (organisation):
World Bank staff estimates based on IMF balance of payments data.
Catégories:
Economy & Growth, Financial Sector, External Debt
Dernière mise à jour
23 avr. 2017
Les indicateurs de changement de valeurs selon les années
Minimum:
22.638 mln.
1 janv. 1972
Maximum:
39.839 mds
1 janv. 2016
Pour la date d''observation
Valeur
Changement absolu
Le changement par rapport à la valeur précédente
1 janv. 1971
22.66 mln.
+22.66 mln.
0.0%
1 janv. 1972
22.638 mln.
-21.782 milles
-0.1%
1 janv. 1973
30.732 mln.
+8.094 mln.
35.75%
1 janv. 1974
28.418 mln.
-2.314 mln.
-7.53%
1 janv. 1975
109.084 mln.
+80.666 mln.
283.85%
1 janv. 1976
362.108 mln.
+253.024 mln.
231.95%
1 janv. 1977
419.619 mln.
+57.512 mln.
15.88%
1 janv. 1978
603.212 mln.
+183.592 mln.
43.75%
1 janv. 1979
716.603 mln.
+113.391 mln.
18.8%
1 janv. 1980
936.463 mln.
+219.86 mln.
30.68%
1 janv. 1981
1.398 mds
+461.295 mln.
49.26%
1 janv. 1982
1.535 mds
+137.266 mln.
9.82%
1 janv. 1983
1.224 mds
-310.548 mln.
-20.23%
1 janv. 1984
1.386 mds
+161.811 mln.
13.21%
1 janv. 1985
1.23 mds
-156.516 mln.
-11.29%
1 janv. 1986
1.146 mds
-84.127 mln.
-6.84%
1 janv. 1987
1.18 mds
+34.575 mln.
3.02%
1 janv. 1988
1.399 mds
+218.852 mln.
18.54%
1 janv. 1989
1.598 mds
+199.125 mln.
14.23%
1 janv. 1990
1.86 mds
+261.627 mln.
16.37%
1 janv. 1991
1.792 mds
-67.549 mln.
-3.63%
1 janv. 1992
1.786 mds
-6.355 mln.
-0.35%
1 janv. 1993
2.026 mds
+239.832 mln.
13.43%
1 janv. 1994
2.504 mds
+478.738 mln.
23.63%
1 janv. 1995
2.306 mds
-198.685 mln.
-7.93%
1 janv. 1996
3.174 mds
+868.459 mln.
37.66%
1 janv. 1997
3.165 mds
-9.255 mln.
-0.29%
1 janv. 1998
4.39 mds
+1.225 mds
38.71%
1 janv. 1999
4.328 mds
-62.554 mln.
-1.42%
1 janv. 2000
4.417 mds
+89.089 mln.
2.06%
1 janv. 2001
4.798 mds
+380.952 mln.
8.63%
1 janv. 2002
4.084 mds
-713.765 mln.
-14.88%
1 janv. 2003
4.627 mds
+543.316 mln.
13.3%
1 janv. 2004
5.514 mds
+887.125 mln.
19.17%
1 janv. 2005
7.812 mds
+2.297 mds
41.66%
1 janv. 2006
20.145 mds
+12.333 mds
157.88%
1 janv. 2007
23.348 mds
+3.203 mds
15.9%
1 janv. 2008
25.883 mds
+2.535 mds
10.86%
1 janv. 2009
28.515 mds
+2.632 mds
10.17%
1 janv. 2010
28.435 mds
-79.876 mln.
-0.28%
1 janv. 2011
31.266 mds
+2.831 mds
9.96%
1 janv. 2012
35.762 mds
+4.496 mds
14.38%
1 janv. 2013
36.204 mds
+442.138 mln.
1.24%
1 janv. 2014
36.329 mds
+125.72 mln.
0.35%
1 janv. 2015
36.906 mds
+576.587 mln.
1.59%
1 janv. 2016
39.839 mds
+2.933 mds
7.95%
Classement des pays selon les statistiques actuelles par années


Commentaires: