29
/fr/
fr
AIzaSyAYiBZKx7MnpbEhh9jyipgxe19OcubqV5w
April 1, 2024
49390
Middle East & North Africa (excluding high income)
MNA
false
2
1
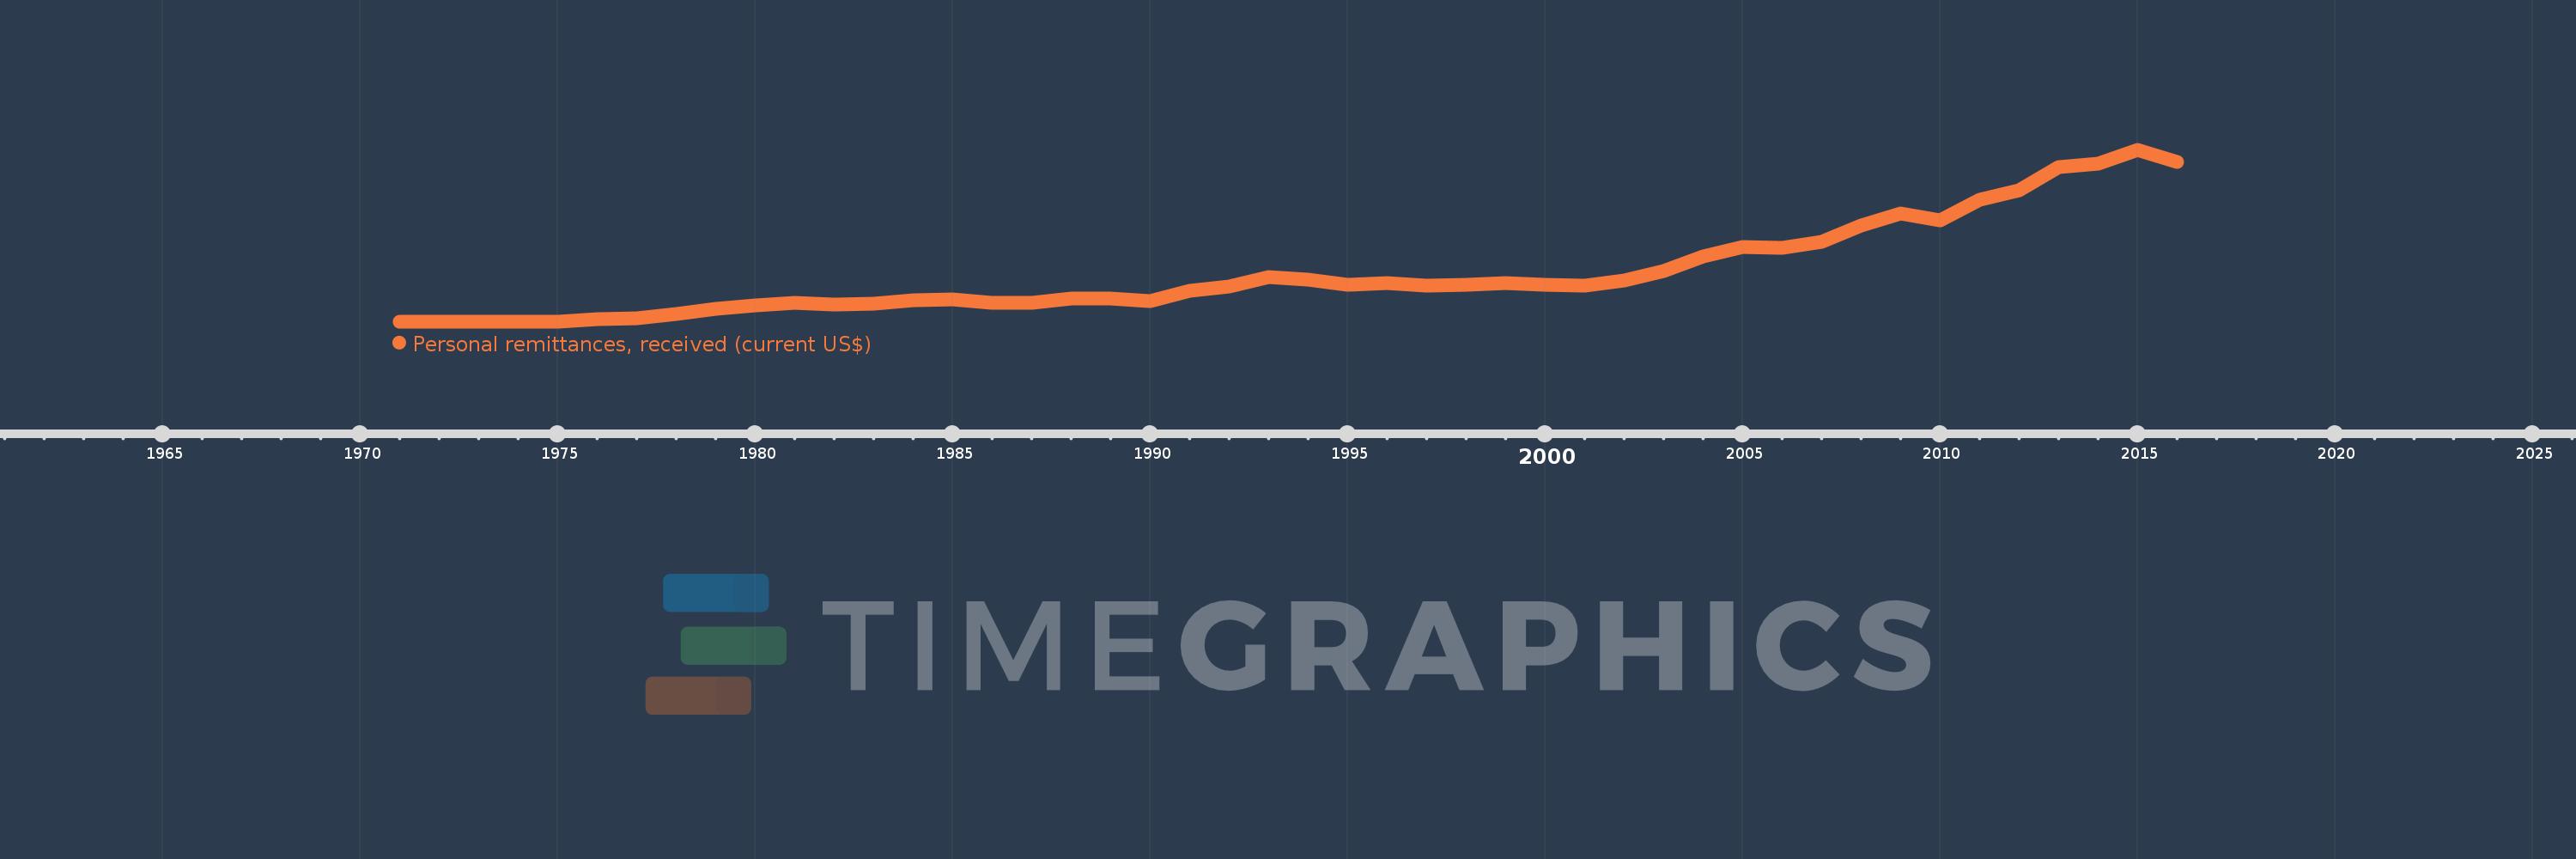
Personal remittances, received (current US$)
2016,2015,2014,2013,2012,2011,2010,2009,2008,2007,2006,2005,2004,2003,2002,2001,2000,1999,1998,1997,1996,1995,1994,1993,1992,1991,1990,1989,1988,1987,1986,1985,1984,1983,1982,1981,1980,1979,1978,1977,1976,1975,1974,1973,1972,1971
Cette statistique dans les autres pays:
AfghanistanAlbaniaAlgeriaAngolaAntigua and BarbudaArab WorldArgentinaArmeniaArubaAustraliaAustriaAzerbaijanBangladeshBarbadosBelarusBelgiumBelizeBeninBermudaBhutanBoliviaBosnia and HerzegovinaBotswanaBrazilBulgariaBurkina FasoBurundiCabo VerdeCambodiaCameroonCanadaCaribbean small statesCentral African RepublicCentral Europe and the BalticsChadChileChinaColombiaComorosCongo, Dem. Rep.Congo, Rep.Costa RicaCote d'IvoireCroatiaCuracaoCyprusCzech RepublicDenmarkDjiboutiDominicaDominican RepublicEarly-demographic dividendEast Asia & PacificEast Asia & Pacific (excluding high income)East Asia & Pacific (IDA & IBRD countries)EcuadorEgypt, Arab Rep.El SalvadorEquatorial GuineaEritreaEstoniaEthiopiaEuro areaEurope & Central AsiaEurope & Central Asia (excluding high income)Europe & Central Asia (IDA & IBRD countries)European UnionFaroe IslandsFijiFinlandFragile and conflict affected situationsFranceFrench PolynesiaGabonGambia, TheGeorgiaGermanyGhanaGreeceGrenadaGuatemalaGuineaGuinea-BissauGuyanaHaitiHeavily indebted poor countries (HIPC)High incomeHondurasHong Kong SAR, ChinaHungaryIBRD onlyIcelandIDA & IBRD totalIDA blendIDA onlyIDA totalIndiaIndonesiaIran, Islamic Rep.IraqIrelandIsraelItalyJamaicaJapanJordanKazakhstanKenyaKiribatiKorea, Rep.KosovoKuwaitKyrgyz RepublicLao PDRLate-demographic dividendLatin America & Caribbean Latin America & Caribbean (excluding high income)Latin America & the Caribbean (IDA & IBRD countries)LatviaLeast developed countries: UN classificationLebanonLesothoLiberiaLibyaLithuaniaLow & middle incomeLow incomeLower middle incomeLuxembourgMacao SAR, ChinaMacedonia, FYRMadagascarMalawiMalaysiaMaldivesMaliMaltaMarshall IslandsMauritaniaMauritiusMexicoMicronesia, Fed. Sts.Middle East & North AfricaMiddle East & North Africa (excluding high income)Middle East & North Africa (IDA & IBRD countries)Middle incomeMoldovaMongoliaMontenegroMoroccoMozambiqueMyanmarNamibiaNepalNetherlandsNew CaledoniaNew ZealandNicaraguaNigerNigeriaNorth AmericaNorwayOECD membersOmanOther small statesPacific island small statesPakistanPalauPanamaPapua New GuineaParaguayPeruPhilippinesPolandPortugalPost-demographic dividendPre-demographic dividendQatarRomaniaRussian FederationRwandaSamoaSao Tome and PrincipeSaudi ArabiaSenegalSerbiaSeychellesSierra LeoneSint Maarten (Dutch part)Slovak RepublicSloveniaSmall statesSolomon IslandsSomaliaSouth AfricaSouth AsiaSouth Asia (IDA & IBRD)South SudanSpainSri LankaSt. Kitts and NevisSt. LuciaSt. Vincent and the GrenadinesSub-Saharan Africa Sub-Saharan Africa (excluding high income)Sub-Saharan Africa (IDA & IBRD countries)SudanSurinameSwazilandSwedenSwitzerlandSyrian Arab RepublicTajikistanTanzaniaThailandTimor-LesteTogoTongaTrinidad and TobagoTunisiaTurkeyTurkmenistanTuvaluUgandaUkraineUnited KingdomUnited StatesUpper middle incomeUruguayUzbekistanVanuatuVenezuela, RBVietnamWest Bank and GazaWorldYemen, Rep.ZambiaZimbabwe La ligne de temps
Cette échelle de temps montre un graphique de 1971 année à 2016 année Middle East & North Africa (excluding high income). Les données jusqu'à 1970 année ne sont pas présentés. Quantité d'observations actuelles selon dates: 46.
Source (désignation):
Les indicateurs du développement mondiale
Source (organisation):
World Bank staff estimates based on IMF balance of payments data.
Catégories:
Economy & Growth, Financial Sector, External Debt
Dernière mise à jour
23 avr. 2017
Les indicateurs de changement de valeurs selon les années
Minimum:
211.0 mln.
1 janv. 1971
Maximum:
52.289 mds
1 janv. 2015
Pour la date d''observation
Valeur
Changement absolu
Le changement par rapport à la valeur précédente
1 janv. 1971
211.0 mln.
+211.0 mln.
0.0%
1 janv. 1972
238.0 mln.
+27.0 mln.
12.8%
1 janv. 1973
247.72 mln.
+9.72 mln.
4.08%
1 janv. 1974
269.739 mln.
+22.019 mln.
8.89%
1 janv. 1975
276.823 mln.
+7.084 mln.
2.63%
1 janv. 1976
965.677 mln.
+688.854 mln.
248.84%
1 janv. 1977
1.355 mds
+389.597 mln.
40.34%
1 janv. 1978
2.596 mds
+1.241 mds
91.57%
1 janv. 1979
4.307 mds
+1.711 mds
65.9%
1 janv. 1980
5.364 mds
+1.057 mds
24.55%
1 janv. 1981
6.042 mds
+677.592 mln.
12.63%
1 janv. 1982
5.471 mds
-570.729 mln.
-9.45%
1 janv. 1983
5.661 mds
+190.02 mln.
3.47%
1 janv. 1984
6.83 mds
+1.169 mds
20.65%
1 janv. 1985
7.04 mds
+209.764 mln.
3.07%
1 janv. 1986
6.14 mds
-900.354 mln.
-12.79%
1 janv. 1987
6.118 mds
-21.633 mln.
-0.35%
1 janv. 1988
7.411 mds
+1.293 mds
21.13%
1 janv. 1989
7.206 mds
-204.735 mln.
-2.76%
1 janv. 1990
6.482 mds
-724.09 mln.
-10.05%
1 janv. 1991
9.575 mds
+3.093 mds
47.72%
1 janv. 1992
10.868 mds
+1.293 mds
13.5%
1 janv. 1993
13.817 mds
+2.949 mds
27.13%
1 janv. 1994
13.159 mds
-657.637 mln.
-4.76%
1 janv. 1995
11.425 mds
-1.734 mds
-13.18%
1 janv. 1996
12.05 mds
+625.207 mln.
5.47%
1 janv. 1997
11.249 mds
-801.48 mln.
-6.65%
1 janv. 1998
11.595 mds
+346.501 mln.
3.08%
1 janv. 1999
11.978 mds
+383.02 mln.
3.3%
1 janv. 2000
11.533 mds
-445.051 mln.
-3.72%
1 janv. 2001
11.333 mds
-199.934 mln.
-1.73%
1 janv. 2002
12.755 mds
+1.422 mds
12.55%
1 janv. 2003
15.664 mds
+2.909 mds
22.8%
1 janv. 2004
20.199 mds
+4.535 mds
28.95%
1 janv. 2005
22.935 mds
+2.736 mds
13.54%
1 janv. 2006
22.782 mds
-152.398 mln.
-0.66%
1 janv. 2007
24.483 mds
+1.701 mds
7.47%
1 janv. 2008
29.394 mds
+4.911 mds
20.06%
1 janv. 2009
33.052 mds
+3.658 mds
12.45%
1 janv. 2010
31.078 mds
-1.974 mds
-5.97%
1 janv. 2011
37.139 mds
+6.06 mds
19.5%
1 janv. 2012
40.139 mds
+3.0 mds
8.08%
1 janv. 2013
47.089 mds
+6.95 mds
17.32%
1 janv. 2014
48.225 mds
+1.136 mds
2.41%
1 janv. 2015
52.289 mds
+4.064 mds
8.43%
1 janv. 2016
48.621 mds
-3.668 mds
-7.01%
Classement des pays selon les statistiques actuelles par années


Commentaires: