29
/fr/
fr
AIzaSyAYiBZKx7MnpbEhh9jyipgxe19OcubqV5w
April 1, 2024
56538
Small states
SST
false
2
1
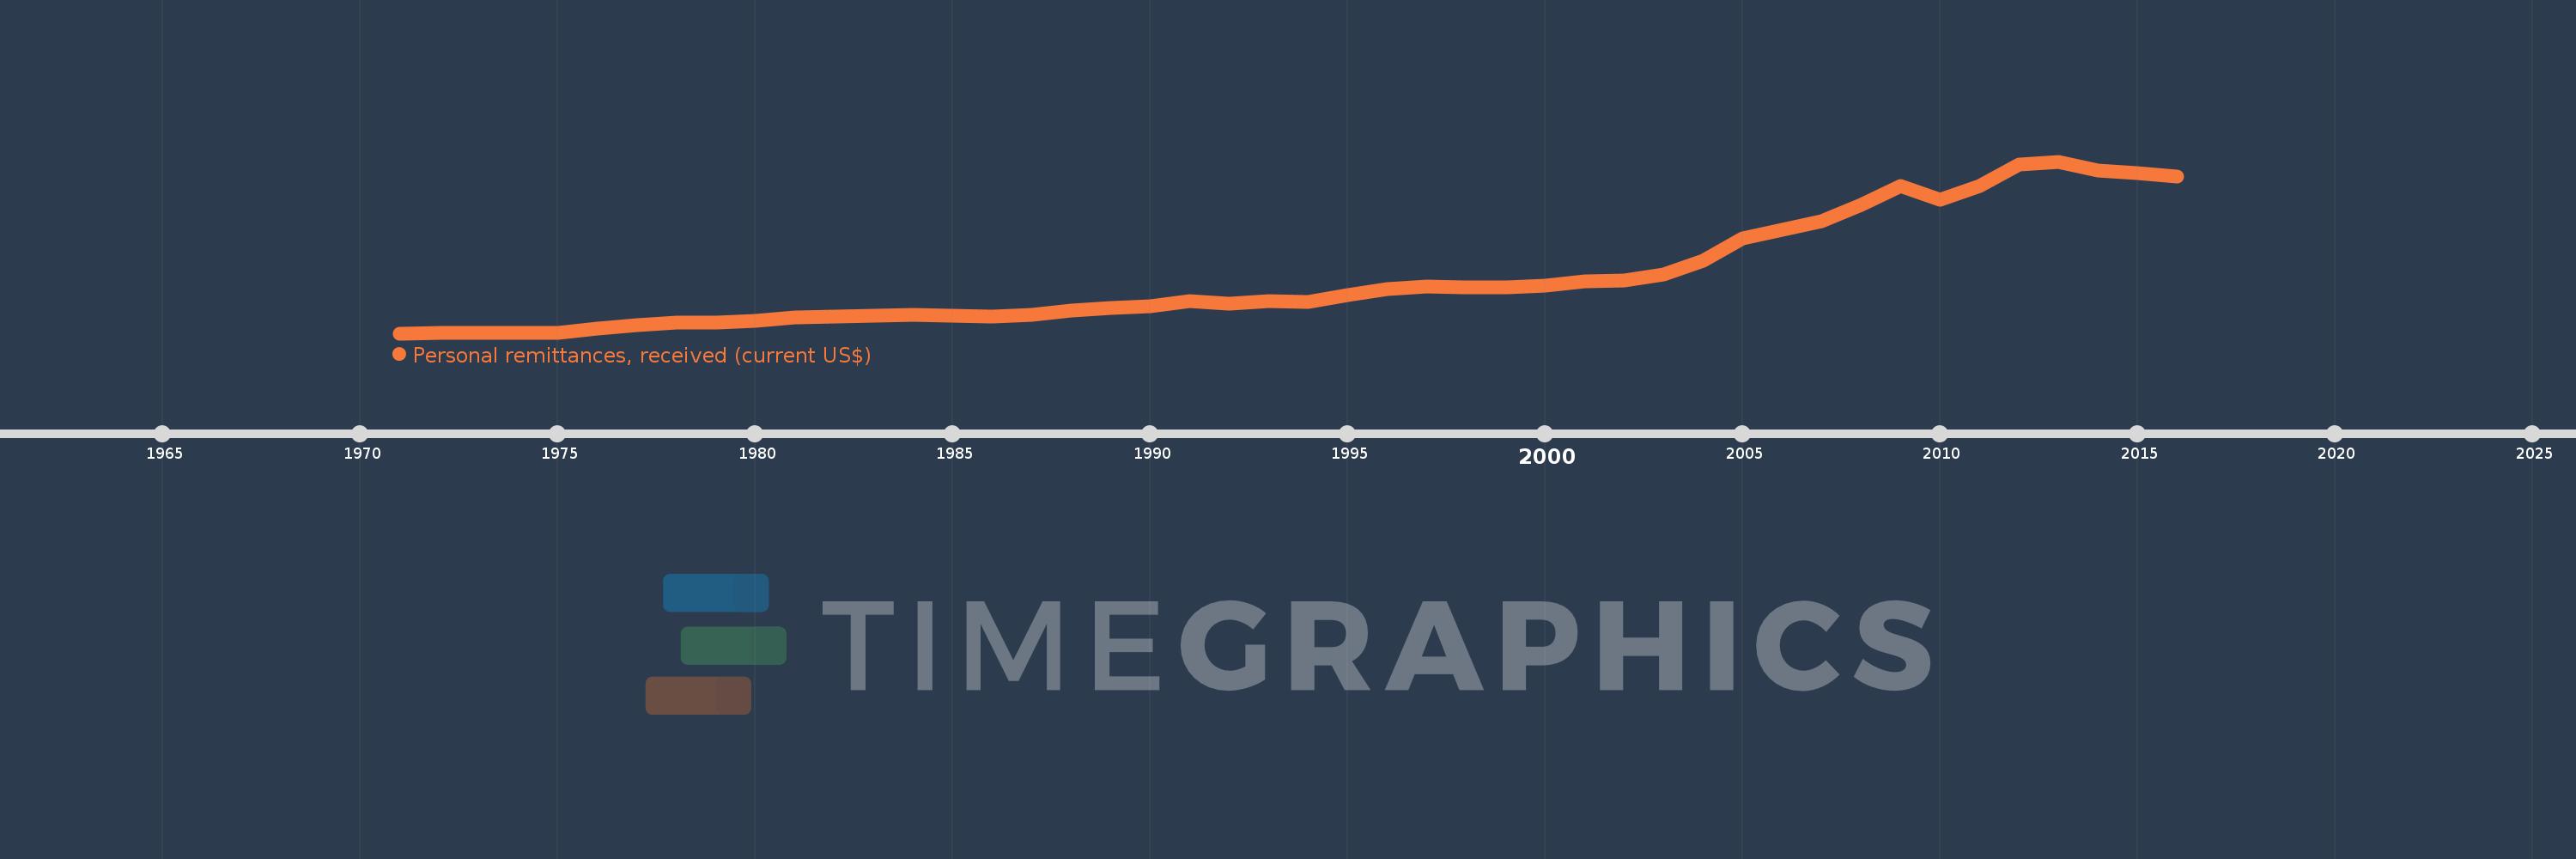
Personal remittances, received (current US$)
2016,2015,2014,2013,2012,2011,2010,2009,2008,2007,2006,2005,2004,2003,2002,2001,2000,1999,1998,1997,1996,1995,1994,1993,1992,1991,1990,1989,1988,1987,1986,1985,1984,1983,1982,1981,1980,1979,1978,1977,1976,1975,1974,1973,1972,1971
Cette statistique dans les autres pays:
AfghanistanAlbaniaAlgeriaAngolaAntigua and BarbudaArab WorldArgentinaArmeniaArubaAustraliaAustriaAzerbaijanBangladeshBarbadosBelarusBelgiumBelizeBeninBermudaBhutanBoliviaBosnia and HerzegovinaBotswanaBrazilBulgariaBurkina FasoBurundiCabo VerdeCambodiaCameroonCanadaCaribbean small statesCentral African RepublicCentral Europe and the BalticsChadChileChinaColombiaComorosCongo, Dem. Rep.Congo, Rep.Costa RicaCote d'IvoireCroatiaCuracaoCyprusCzech RepublicDenmarkDjiboutiDominicaDominican RepublicEarly-demographic dividendEast Asia & PacificEast Asia & Pacific (excluding high income)East Asia & Pacific (IDA & IBRD countries)EcuadorEgypt, Arab Rep.El SalvadorEquatorial GuineaEritreaEstoniaEthiopiaEuro areaEurope & Central AsiaEurope & Central Asia (excluding high income)Europe & Central Asia (IDA & IBRD countries)European UnionFaroe IslandsFijiFinlandFragile and conflict affected situationsFranceFrench PolynesiaGabonGambia, TheGeorgiaGermanyGhanaGreeceGrenadaGuatemalaGuineaGuinea-BissauGuyanaHaitiHeavily indebted poor countries (HIPC)High incomeHondurasHong Kong SAR, ChinaHungaryIBRD onlyIcelandIDA & IBRD totalIDA blendIDA onlyIDA totalIndiaIndonesiaIran, Islamic Rep.IraqIrelandIsraelItalyJamaicaJapanJordanKazakhstanKenyaKiribatiKorea, Rep.KosovoKuwaitKyrgyz RepublicLao PDRLate-demographic dividendLatin America & Caribbean Latin America & Caribbean (excluding high income)Latin America & the Caribbean (IDA & IBRD countries)LatviaLeast developed countries: UN classificationLebanonLesothoLiberiaLibyaLithuaniaLow & middle incomeLow incomeLower middle incomeLuxembourgMacao SAR, ChinaMacedonia, FYRMadagascarMalawiMalaysiaMaldivesMaliMaltaMarshall IslandsMauritaniaMauritiusMexicoMicronesia, Fed. Sts.Middle East & North AfricaMiddle East & North Africa (excluding high income)Middle East & North Africa (IDA & IBRD countries)Middle incomeMoldovaMongoliaMontenegroMoroccoMozambiqueMyanmarNamibiaNepalNetherlandsNew CaledoniaNew ZealandNicaraguaNigerNigeriaNorth AmericaNorwayOECD membersOmanOther small statesPacific island small statesPakistanPalauPanamaPapua New GuineaParaguayPeruPhilippinesPolandPortugalPost-demographic dividendPre-demographic dividendQatarRomaniaRussian FederationRwandaSamoaSao Tome and PrincipeSaudi ArabiaSenegalSerbiaSeychellesSierra LeoneSint Maarten (Dutch part)Slovak RepublicSloveniaSmall statesSolomon IslandsSomaliaSouth AfricaSouth AsiaSouth Asia (IDA & IBRD)South SudanSpainSri LankaSt. Kitts and NevisSt. LuciaSt. Vincent and the GrenadinesSub-Saharan Africa Sub-Saharan Africa (excluding high income)Sub-Saharan Africa (IDA & IBRD countries)SudanSurinameSwazilandSwedenSwitzerlandSyrian Arab RepublicTajikistanTanzaniaThailandTimor-LesteTogoTongaTrinidad and TobagoTunisiaTurkeyTurkmenistanTuvaluUgandaUkraineUnited KingdomUnited StatesUpper middle incomeUruguayUzbekistanVanuatuVenezuela, RBVietnamWest Bank and GazaWorldYemen, Rep.ZambiaZimbabwe La ligne de temps
Cette échelle de temps montre un graphique de 1971 année à 2016 année Small states. Les données jusqu'à 1970 année ne sont pas présentés. Quantité d'observations actuelles selon dates: 46.
Source (désignation):
Les indicateurs du développement mondiale
Source (organisation):
World Bank staff estimates based on IMF balance of payments data.
Catégories:
Economy & Growth, Financial Sector, External Debt
Dernière mise à jour
23 avr. 2017
Les indicateurs de changement de valeurs selon les années
Minimum:
4.4 mln.
1 janv. 1971
Maximum:
7.546 mds
1 janv. 2013
Pour la date d''observation
Valeur
Changement absolu
Le changement par rapport à la valeur précédente
1 janv. 1971
4.4 mln.
+4.4 mln.
0.0%
1 janv. 1972
23.579 mln.
+19.179 mln.
435.88%
1 janv. 1973
23.529 mln.
-49.198 milles
-0.21%
1 janv. 1974
27.965 mln.
+4.436 mln.
18.85%
1 janv. 1975
34.858 mln.
+6.892 mln.
24.65%
1 janv. 1976
213.183 mln.
+178.325 mln.
511.58%
1 janv. 1977
380.946 mln.
+167.763 mln.
78.69%
1 janv. 1978
470.237 mln.
+89.291 mln.
23.44%
1 janv. 1979
481.097 mln.
+10.86 mln.
2.31%
1 janv. 1980
564.039 mln.
+82.942 mln.
17.24%
1 janv. 1981
707.879 mln.
+143.84 mln.
25.5%
1 janv. 1982
729.554 mln.
+21.676 mln.
3.06%
1 janv. 1983
778.234 mln.
+48.679 mln.
6.67%
1 janv. 1984
806.803 mln.
+28.57 mln.
3.67%
1 janv. 1985
758.602 mln.
-48.201 mln.
-5.97%
1 janv. 1986
734.426 mln.
-24.176 mln.
-3.19%
1 janv. 1987
810.238 mln.
+75.812 mln.
10.32%
1 janv. 1988
1.02 mds
+210.119 mln.
25.93%
1 janv. 1989
1.111 mds
+90.64 mln.
8.88%
1 janv. 1990
1.207 mds
+96.465 mln.
8.68%
1 janv. 1991
1.406 mds
+198.434 mln.
16.43%
1 janv. 1992
1.291 mds
-115.055 mln.
-8.18%
1 janv. 1993
1.402 mds
+111.184 mln.
8.61%
1 janv. 1994
1.378 mds
-24.159 mln.
-1.72%
1 janv. 1995
1.697 mds
+319.501 mln.
23.19%
1 janv. 1996
1.935 mds
+237.162 mln.
13.97%
1 janv. 1997
2.044 mds
+109.012 mln.
5.64%
1 janv. 1998
2.039 mds
-4.725 mln.
-0.23%
1 janv. 1999
2.022 mds
-17.039 mln.
-0.84%
1 janv. 2000
2.083 mds
+60.824 mln.
3.01%
1 janv. 2001
2.272 mds
+188.915 mln.
9.07%
1 janv. 2002
2.336 mds
+64.39 mln.
2.83%
1 janv. 2003
2.598 mds
+262.129 mln.
11.22%
1 janv. 2004
3.199 mds
+601.366 mln.
23.15%
1 janv. 2005
4.158 mds
+958.717 mln.
29.97%
1 janv. 2006
4.551 mds
+393.224 mln.
9.46%
1 janv. 2007
4.939 mds
+387.294 mln.
8.51%
1 janv. 2008
5.633 mds
+694.763 mln.
14.07%
1 janv. 2009
6.466 mds
+832.705 mln.
14.78%
1 janv. 2010
5.871 mds
-595.397 mln.
-9.21%
1 janv. 2011
6.477 mds
+606.582 mln.
10.33%
1 janv. 2012
7.404 mds
+926.923 mln.
14.31%
1 janv. 2013
7.546 mds
+142.078 mln.
1.92%
1 janv. 2014
7.154 mds
-392.433 mln.
-5.2%
1 janv. 2015
7.029 mds
-124.94 mln.
-1.75%
1 janv. 2016
6.89 mds
-139.229 mln.
-1.98%
Classement des pays selon les statistiques actuelles par années


Commentaires: