29
/fr/
fr
AIzaSyAYiBZKx7MnpbEhh9jyipgxe19OcubqV5w
April 1, 2024
100383
Cameroon
CMR
true
2
1
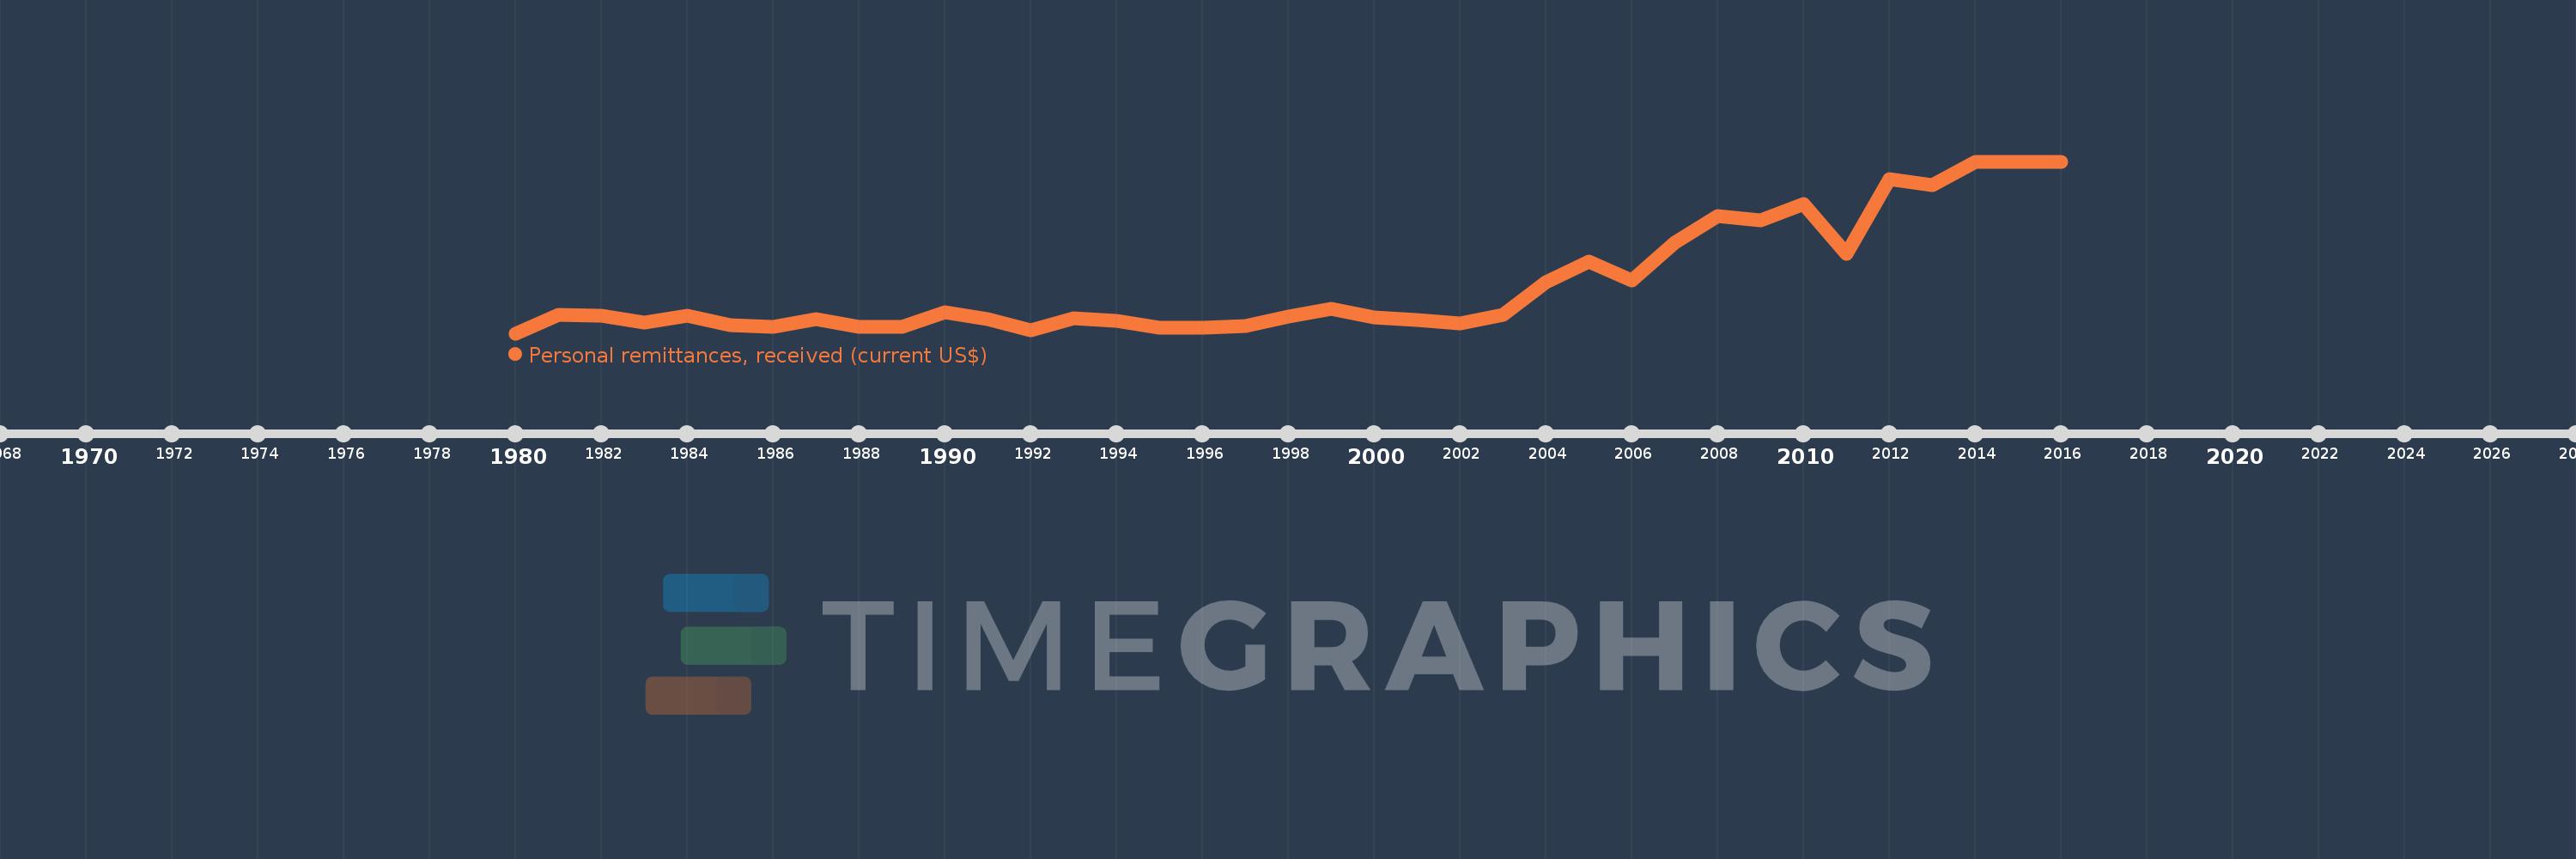
Personal remittances, received (current US$)
2016,2015,2014,2013,2012,2011,2010,2009,2008,2007,2006,2005,2004,2003,2002,2001,2000,1999,1998,1997,1996,1995,1994,1993,1992,1991,1990,1989,1988,1987,1986,1985,1984,1983,1982,1981,1980
Cette statistique dans les autres pays:
AfghanistanAlbaniaAlgeriaAngolaAntigua and BarbudaArab WorldArgentinaArmeniaArubaAustraliaAustriaAzerbaijanBangladeshBarbadosBelarusBelgiumBelizeBeninBermudaBhutanBoliviaBosnia and HerzegovinaBotswanaBrazilBulgariaBurkina FasoBurundiCabo VerdeCambodiaCameroonCanadaCaribbean small statesCentral African RepublicCentral Europe and the BalticsChadChileChinaColombiaComorosCongo, Dem. Rep.Congo, Rep.Costa RicaCote d'IvoireCroatiaCuracaoCyprusCzech RepublicDenmarkDjiboutiDominicaDominican RepublicEarly-demographic dividendEast Asia & PacificEast Asia & Pacific (excluding high income)East Asia & Pacific (IDA & IBRD countries)EcuadorEgypt, Arab Rep.El SalvadorEquatorial GuineaEritreaEstoniaEthiopiaEuro areaEurope & Central AsiaEurope & Central Asia (excluding high income)Europe & Central Asia (IDA & IBRD countries)European UnionFaroe IslandsFijiFinlandFragile and conflict affected situationsFranceFrench PolynesiaGabonGambia, TheGeorgiaGermanyGhanaGreeceGrenadaGuatemalaGuineaGuinea-BissauGuyanaHaitiHeavily indebted poor countries (HIPC)High incomeHondurasHong Kong SAR, ChinaHungaryIBRD onlyIcelandIDA & IBRD totalIDA blendIDA onlyIDA totalIndiaIndonesiaIran, Islamic Rep.IraqIrelandIsraelItalyJamaicaJapanJordanKazakhstanKenyaKiribatiKorea, Rep.KosovoKuwaitKyrgyz RepublicLao PDRLate-demographic dividendLatin America & Caribbean Latin America & Caribbean (excluding high income)Latin America & the Caribbean (IDA & IBRD countries)LatviaLeast developed countries: UN classificationLebanonLesothoLiberiaLibyaLithuaniaLow & middle incomeLow incomeLower middle incomeLuxembourgMacao SAR, ChinaMacedonia, FYRMadagascarMalawiMalaysiaMaldivesMaliMaltaMarshall IslandsMauritaniaMauritiusMexicoMicronesia, Fed. Sts.Middle East & North AfricaMiddle East & North Africa (excluding high income)Middle East & North Africa (IDA & IBRD countries)Middle incomeMoldovaMongoliaMontenegroMoroccoMozambiqueMyanmarNamibiaNepalNetherlandsNew CaledoniaNew ZealandNicaraguaNigerNigeriaNorth AmericaNorwayOECD membersOmanOther small statesPacific island small statesPakistanPalauPanamaPapua New GuineaParaguayPeruPhilippinesPolandPortugalPost-demographic dividendPre-demographic dividendQatarRomaniaRussian FederationRwandaSamoaSao Tome and PrincipeSaudi ArabiaSenegalSerbiaSeychellesSierra LeoneSint Maarten (Dutch part)Slovak RepublicSloveniaSmall statesSolomon IslandsSomaliaSouth AfricaSouth AsiaSouth Asia (IDA & IBRD)South SudanSpainSri LankaSt. Kitts and NevisSt. LuciaSt. Vincent and the GrenadinesSub-Saharan Africa Sub-Saharan Africa (excluding high income)Sub-Saharan Africa (IDA & IBRD countries)SudanSurinameSwazilandSwedenSwitzerlandSyrian Arab RepublicTajikistanTanzaniaThailandTimor-LesteTogoTongaTrinidad and TobagoTunisiaTurkeyTurkmenistanTuvaluUgandaUkraineUnited KingdomUnited StatesUpper middle incomeUruguayUzbekistanVanuatuVenezuela, RBVietnamWest Bank and GazaWorldYemen, Rep.ZambiaZimbabwe La ligne de temps
Cette échelle de temps montre un graphique de 1980 année à 2016 année Cameroon. Les données jusqu'à 1979 année ne sont pas présentés. Quantité d'observations actuelles selon dates: 37.
Source (désignation):
Les indicateurs du développement mondiale
Source (organisation):
World Bank staff estimates based on IMF balance of payments data.
Catégories:
Economy & Growth, Financial Sector, External Debt
Dernière mise à jour
23 avr. 2017
Les indicateurs de changement de valeurs selon les années
Minimum:
3.479 mln.
1 janv. 1980
Maximum:
244.059 mln.
1 janv. 2014
Pour la date d''observation
Valeur
Changement absolu
Le changement par rapport à la valeur précédente
1 janv. 1980
3.479 mln.
+3.479 mln.
0.0%
1 janv. 1981
29.392 mln.
+25.914 mln.
744.92%
1 janv. 1982
28.705 mln.
-687.527 milles
-2.34%
1 janv. 1983
19.02 mln.
-9.685 mln.
-33.74%
1 janv. 1984
28.0 mln.
+8.981 mln.
47.22%
1 janv. 1985
14.83 mln.
-13.171 mln.
-47.04%
1 janv. 1986
12.22 mln.
-2.61 mln.
-17.6%
1 janv. 1987
23.736 mln.
+11.516 mln.
94.24%
1 janv. 1988
12.777 mln.
-10.959 mln.
-46.17%
1 janv. 1989
12.322 mln.
-455.435 milles
-3.56%
1 janv. 1990
32.57 mln.
+20.248 mln.
164.33%
1 janv. 1991
22.992 mln.
-9.577 mln.
-29.41%
1 janv. 1992
7.338 mln.
-15.655 mln.
-68.09%
1 janv. 1993
25.01 mln.
+17.673 mln.
240.85%
1 janv. 1994
20.342 mln.
-4.669 mln.
-18.67%
1 janv. 1995
11.401 mln.
-8.94 mln.
-43.95%
1 janv. 1996
11.239 mln.
-162.059 milles
-1.42%
1 janv. 1997
13.41 mln.
+2.171 mln.
19.31%
1 janv. 1998
26.585 mln.
+13.175 mln.
98.25%
1 janv. 1999
37.513 mln.
+10.927 mln.
41.1%
1 janv. 2000
26.221 mln.
-11.291 mln.
-30.1%
1 janv. 2001
22.1 mln.
-4.121 mln.
-15.72%
1 janv. 2002
16.832 mln.
-5.268 mln.
-23.84%
1 janv. 2003
29.456 mln.
+12.625 mln.
75.01%
1 janv. 2004
75.415 mln.
+45.958 mln.
156.02%
1 janv. 2005
103.389 mln.
+27.975 mln.
37.09%
1 janv. 2006
76.989 mln.
-26.401 mln.
-25.54%
1 janv. 2007
129.943 mln.
+52.955 mln.
68.78%
1 janv. 2008
167.339 mln.
+37.396 mln.
28.78%
1 janv. 2009
162.015 mln.
-5.324 mln.
-3.18%
1 janv. 2010
184.37 mln.
+22.355 mln.
13.8%
1 janv. 2011
114.859 mln.
-69.511 mln.
-37.7%
1 janv. 2012
219.255 mln.
+104.396 mln.
90.89%
1 janv. 2013
210.42 mln.
-8.835 mln.
-4.03%
1 janv. 2014
244.059 mln.
+33.639 mln.
15.99%
1 janv. 2015
244.059 mln.
-0.022
0.0%
1 janv. 2016
244.059 mln.
0.0
0.0%
Classement des pays selon les statistiques actuelles par années


Commentaires: