29
/fr/
fr
AIzaSyAYiBZKx7MnpbEhh9jyipgxe19OcubqV5w
April 1, 2024
52154
North America
NAC
false
2
1
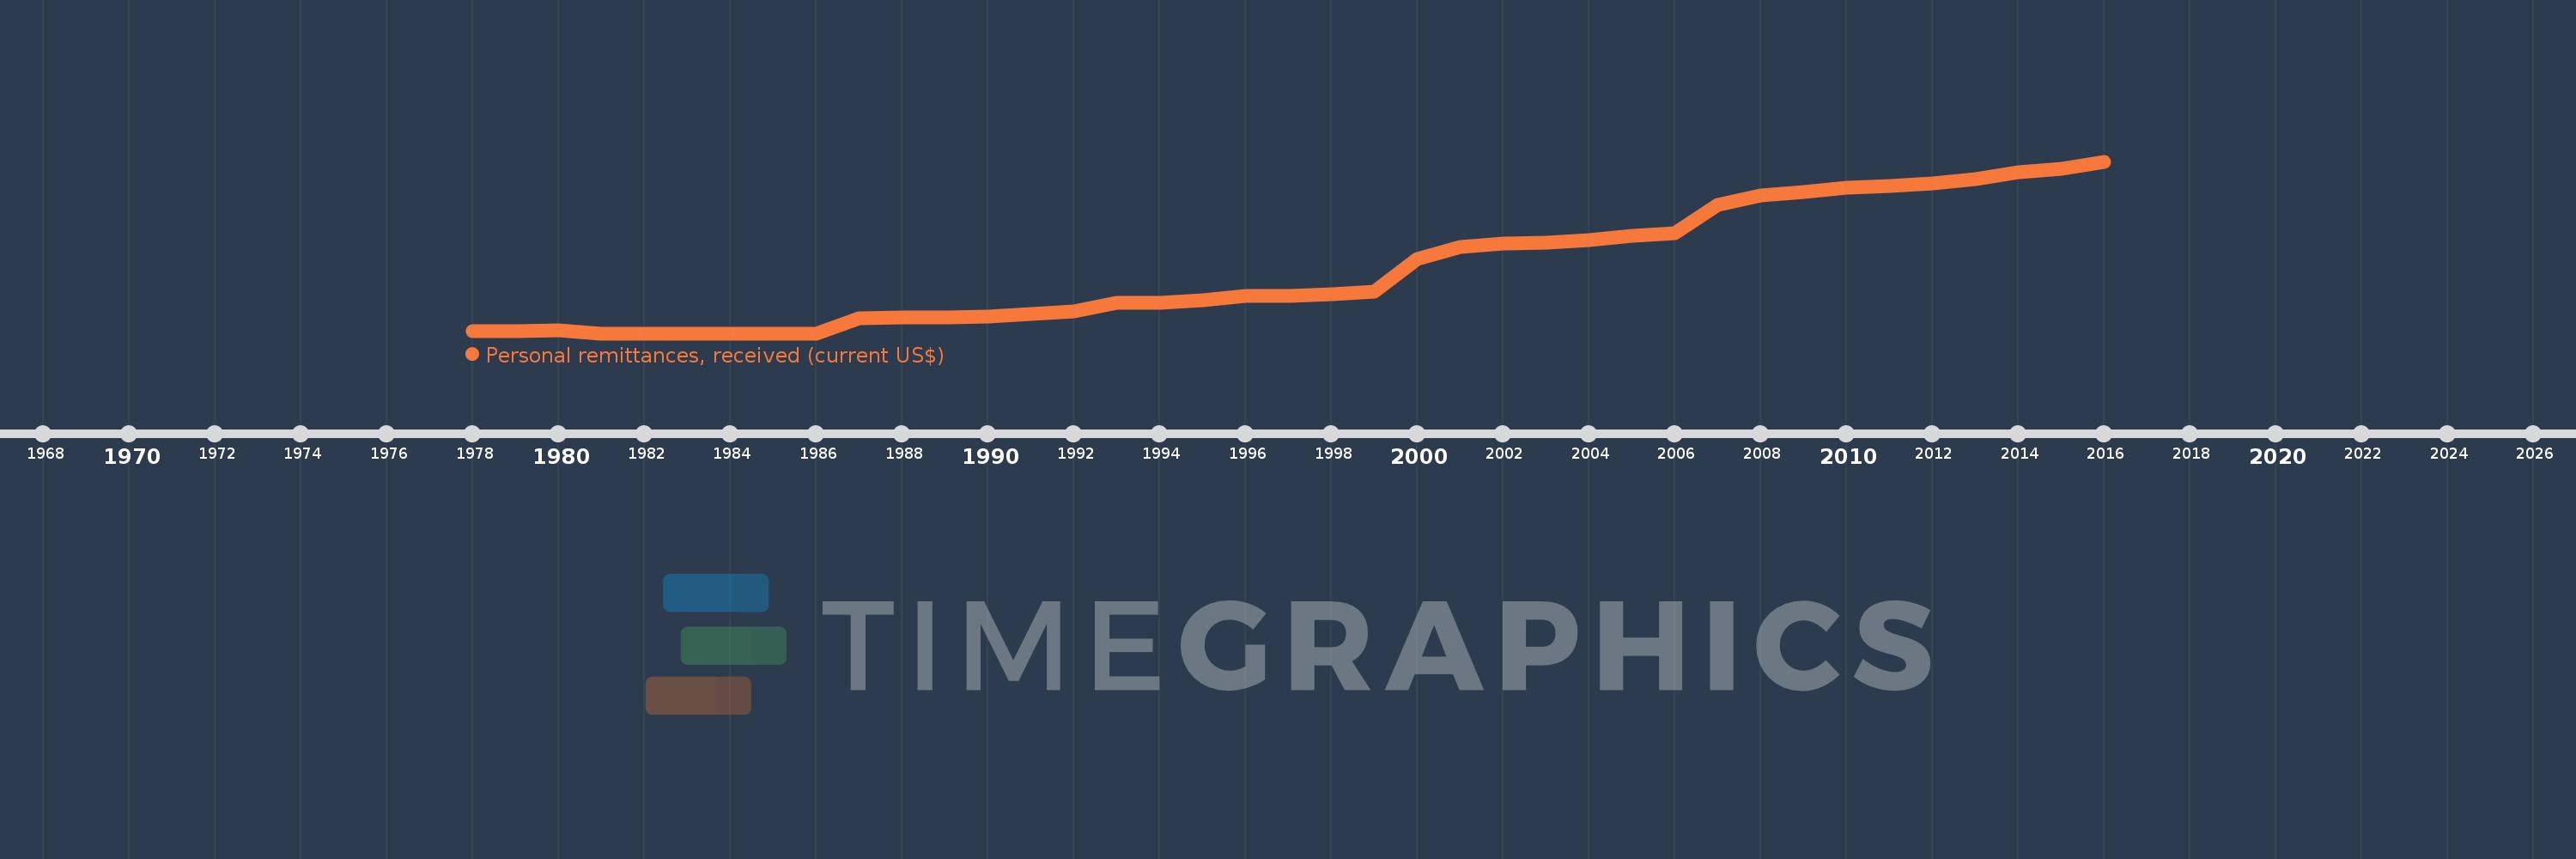
Personal remittances, received (current US$)
2016,2015,2014,2013,2012,2011,2010,2009,2008,2007,2006,2005,2004,2003,2002,2001,2000,1999,1998,1997,1996,1995,1994,1993,1992,1991,1990,1989,1988,1987,1986,1985,1984,1983,1982,1981,1980,1979,1978
Cette statistique dans les autres pays:
AfghanistanAlbaniaAlgeriaAngolaAntigua and BarbudaArab WorldArgentinaArmeniaArubaAustraliaAustriaAzerbaijanBangladeshBarbadosBelarusBelgiumBelizeBeninBermudaBhutanBoliviaBosnia and HerzegovinaBotswanaBrazilBulgariaBurkina FasoBurundiCabo VerdeCambodiaCameroonCanadaCaribbean small statesCentral African RepublicCentral Europe and the BalticsChadChileChinaColombiaComorosCongo, Dem. Rep.Congo, Rep.Costa RicaCote d'IvoireCroatiaCuracaoCyprusCzech RepublicDenmarkDjiboutiDominicaDominican RepublicEarly-demographic dividendEast Asia & PacificEast Asia & Pacific (excluding high income)East Asia & Pacific (IDA & IBRD countries)EcuadorEgypt, Arab Rep.El SalvadorEquatorial GuineaEritreaEstoniaEthiopiaEuro areaEurope & Central AsiaEurope & Central Asia (excluding high income)Europe & Central Asia (IDA & IBRD countries)European UnionFaroe IslandsFijiFinlandFragile and conflict affected situationsFranceFrench PolynesiaGabonGambia, TheGeorgiaGermanyGhanaGreeceGrenadaGuatemalaGuineaGuinea-BissauGuyanaHaitiHeavily indebted poor countries (HIPC)High incomeHondurasHong Kong SAR, ChinaHungaryIBRD onlyIcelandIDA & IBRD totalIDA blendIDA onlyIDA totalIndiaIndonesiaIran, Islamic Rep.IraqIrelandIsraelItalyJamaicaJapanJordanKazakhstanKenyaKiribatiKorea, Rep.KosovoKuwaitKyrgyz RepublicLao PDRLate-demographic dividendLatin America & Caribbean Latin America & Caribbean (excluding high income)Latin America & the Caribbean (IDA & IBRD countries)LatviaLeast developed countries: UN classificationLebanonLesothoLiberiaLibyaLithuaniaLow & middle incomeLow incomeLower middle incomeLuxembourgMacao SAR, ChinaMacedonia, FYRMadagascarMalawiMalaysiaMaldivesMaliMaltaMarshall IslandsMauritaniaMauritiusMexicoMicronesia, Fed. Sts.Middle East & North AfricaMiddle East & North Africa (excluding high income)Middle East & North Africa (IDA & IBRD countries)Middle incomeMoldovaMongoliaMontenegroMoroccoMozambiqueMyanmarNamibiaNepalNetherlandsNew CaledoniaNew ZealandNicaraguaNigerNigeriaNorth AmericaNorwayOECD membersOmanOther small statesPacific island small statesPakistanPalauPanamaPapua New GuineaParaguayPeruPhilippinesPolandPortugalPost-demographic dividendPre-demographic dividendQatarRomaniaRussian FederationRwandaSamoaSao Tome and PrincipeSaudi ArabiaSenegalSerbiaSeychellesSierra LeoneSint Maarten (Dutch part)Slovak RepublicSloveniaSmall statesSolomon IslandsSomaliaSouth AfricaSouth AsiaSouth Asia (IDA & IBRD)South SudanSpainSri LankaSt. Kitts and NevisSt. LuciaSt. Vincent and the GrenadinesSub-Saharan Africa Sub-Saharan Africa (excluding high income)Sub-Saharan Africa (IDA & IBRD countries)SudanSurinameSwazilandSwedenSwitzerlandSyrian Arab RepublicTajikistanTanzaniaThailandTimor-LesteTogoTongaTrinidad and TobagoTunisiaTurkeyTurkmenistanTuvaluUgandaUkraineUnited KingdomUnited StatesUpper middle incomeUruguayUzbekistanVanuatuVenezuela, RBVietnamWest Bank and GazaWorldYemen, Rep.ZambiaZimbabwe La ligne de temps
Cette échelle de temps montre un graphique de 1978 année à 2016 année North America. Les données jusqu'à 1977 année ne sont pas présentés. Quantité d'observations actuelles selon dates: 39.
Source (désignation):
Les indicateurs du développement mondiale
Source (organisation):
World Bank staff estimates based on IMF balance of payments data.
Catégories:
Economy & Growth, Financial Sector, External Debt
Dernière mise à jour
23 avr. 2017
Les indicateurs de changement de valeurs selon les années
Minimum:
80.0 mln.
1 janv. 1981
Maximum:
9.762 mds
1 janv. 2016
Pour la date d''observation
Valeur
Changement absolu
Le changement par rapport à la valeur précédente
1 janv. 1978
200.0 mln.
+200.0 mln.
0.0%
1 janv. 1979
220.0 mln.
+20.0 mln.
10.0%
1 janv. 1980
230.0 mln.
+10.0 mln.
4.55%
1 janv. 1981
80.0 mln.
-150.0 mln.
-65.22%
1 janv. 1982
80.0 mln.
0.0
0.0%
1 janv. 1983
80.0 mln.
0.0
0.0%
1 janv. 1984
80.0 mln.
0.0
0.0%
1 janv. 1985
80.0 mln.
0.0
0.0%
1 janv. 1986
80.0 mln.
0.0
0.0%
1 janv. 1987
908.0 mln.
+828.0 mln.
1.03 milles%
1 janv. 1988
994.0 mln.
+86.0 mln.
9.47%
1 janv. 1989
995.0 mln.
+1000.0 milles
0.1%
1 janv. 1990
1.02 mds
+25.0 mln.
2.51%
1 janv. 1991
1.17 mds
+150.0 mln.
14.71%
1 janv. 1992
1.3 mds
+130.0 mln.
11.11%
1 janv. 1993
1.796 mds
+496.0 mln.
38.15%
1 janv. 1994
1.82 mds
+24.0 mln.
1.34%
1 janv. 1995
1.943 mds
+123.0 mln.
6.76%
1 janv. 1996
2.179 mds
+236.0 mln.
12.15%
1 janv. 1997
2.181 mds
+2.0 mln.
0.09%
1 janv. 1998
2.27 mds
+89.0 mln.
4.08%
1 janv. 1999
2.437 mds
+167.0 mln.
7.36%
1 janv. 2000
4.246 mds
+1.809 mds
74.23%
1 janv. 2001
4.95 mds
+703.663 mln.
16.57%
1 janv. 2002
5.124 mds
+174.558 mln.
3.53%
1 janv. 2003
5.206 mds
+81.526 mln.
1.59%
1 janv. 2004
5.344 mds
+138.526 mln.
2.66%
1 janv. 2005
5.562 mds
+217.639 mln.
4.07%
1 janv. 2006
5.728 mds
+166.476 mln.
2.99%
1 janv. 2007
7.336 mds
+1.608 mds
28.07%
1 janv. 2008
7.847 mds
+510.334 mln.
6.96%
1 janv. 2009
8.054 mds
+207.738 mln.
2.65%
1 janv. 2010
8.281 mds
+226.891 mln.
2.82%
1 janv. 2011
8.391 mds
+109.378 mln.
1.32%
1 janv. 2012
8.506 mds
+115.772 mln.
1.38%
1 janv. 2013
8.749 mds
+242.314 mln.
2.85%
1 janv. 2014
9.175 mds
+426.262 mln.
4.87%
1 janv. 2015
9.328 mds
+153.539 mln.
1.67%
1 janv. 2016
9.762 mds
+433.907 mln.
4.65%
Classement des pays selon les statistiques actuelles par années


Commentaires: