29
/fr/
fr
AIzaSyAYiBZKx7MnpbEhh9jyipgxe19OcubqV5w
April 1, 2024
130949
Ethiopia
ETH
true
2
1
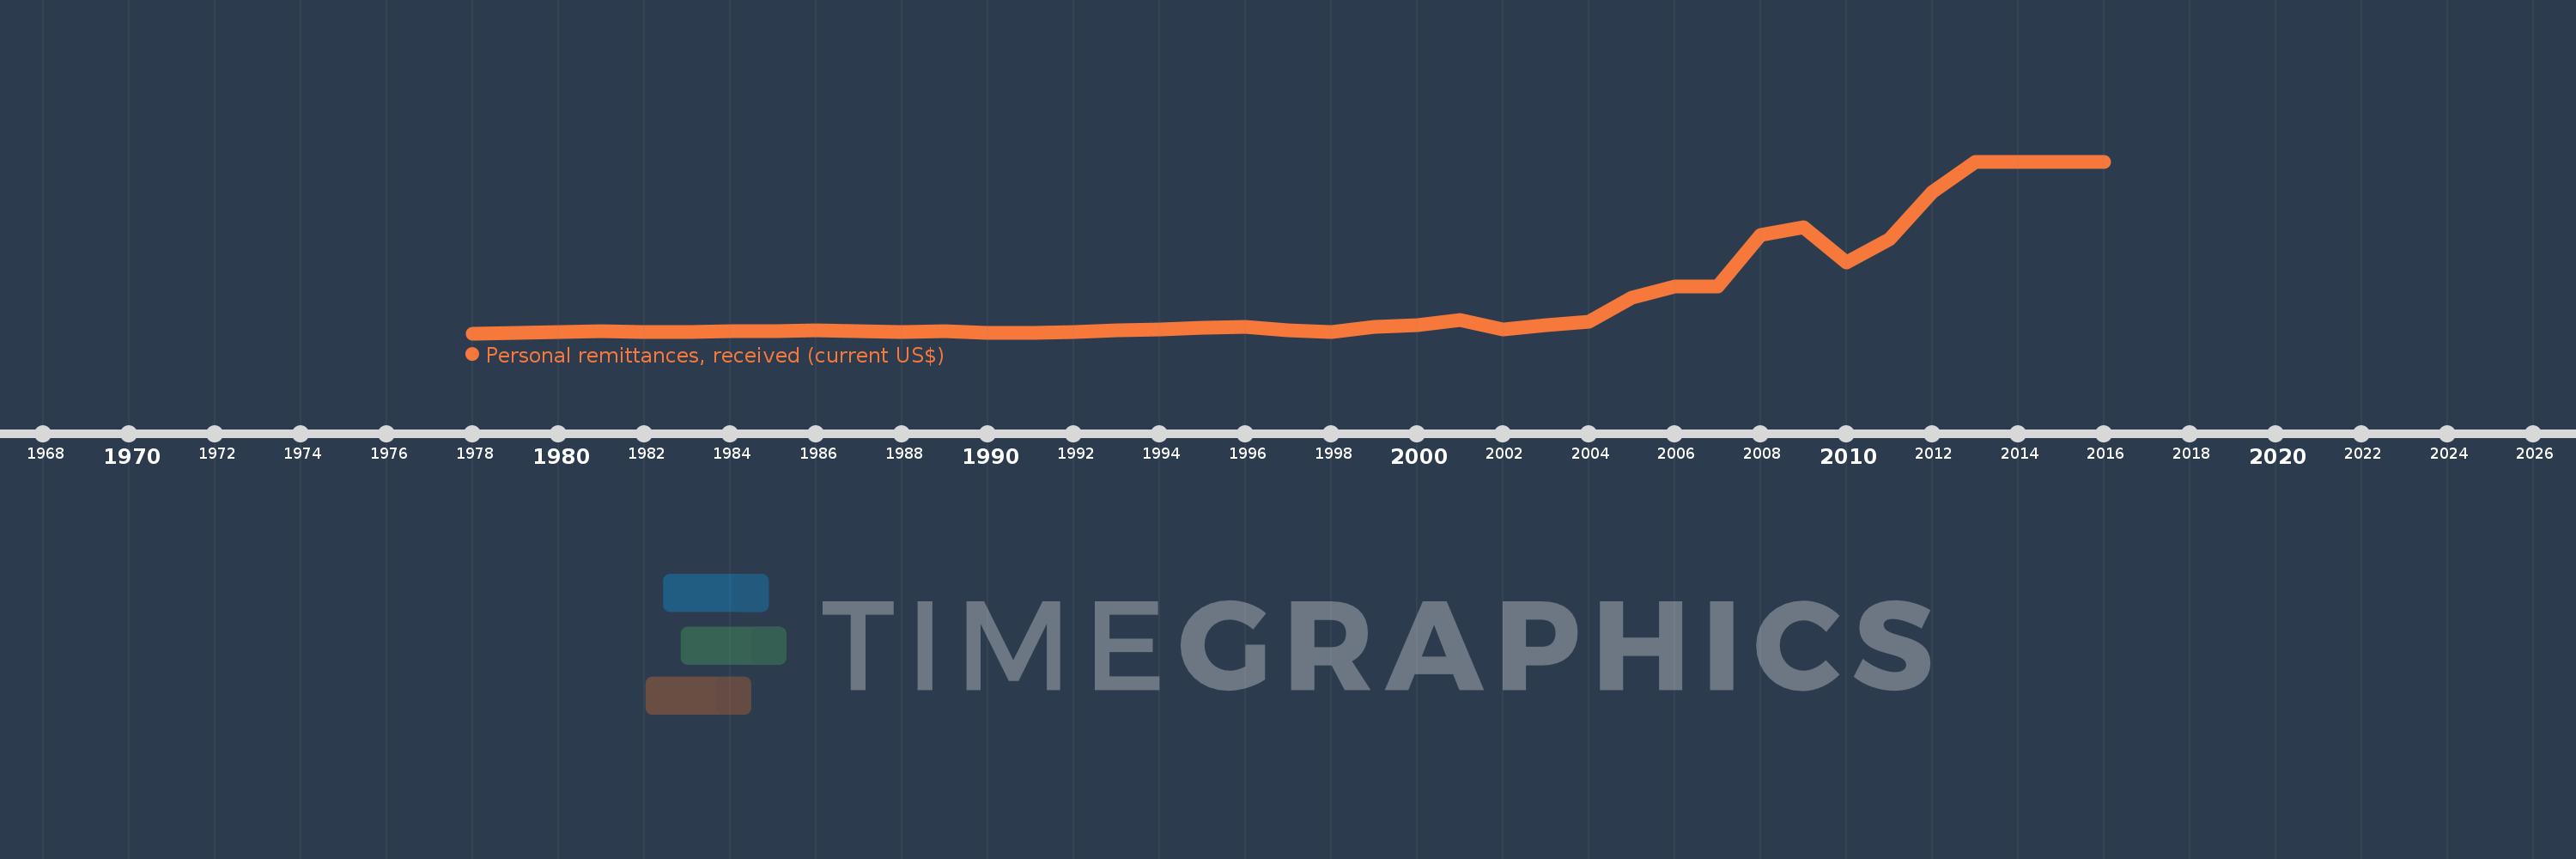
Personal remittances, received (current US$)
2016,2015,2014,2013,2012,2011,2010,2009,2008,2007,2006,2005,2004,2003,2002,2001,2000,1999,1998,1997,1996,1995,1994,1993,1992,1991,1990,1989,1988,1987,1986,1985,1984,1983,1982,1981,1980,1979,1978
Cette statistique dans les autres pays:
AfghanistanAlbaniaAlgeriaAngolaAntigua and BarbudaArab WorldArgentinaArmeniaArubaAustraliaAustriaAzerbaijanBangladeshBarbadosBelarusBelgiumBelizeBeninBermudaBhutanBoliviaBosnia and HerzegovinaBotswanaBrazilBulgariaBurkina FasoBurundiCabo VerdeCambodiaCameroonCanadaCaribbean small statesCentral African RepublicCentral Europe and the BalticsChadChileChinaColombiaComorosCongo, Dem. Rep.Congo, Rep.Costa RicaCote d'IvoireCroatiaCuracaoCyprusCzech RepublicDenmarkDjiboutiDominicaDominican RepublicEarly-demographic dividendEast Asia & PacificEast Asia & Pacific (excluding high income)East Asia & Pacific (IDA & IBRD countries)EcuadorEgypt, Arab Rep.El SalvadorEquatorial GuineaEritreaEstoniaEthiopiaEuro areaEurope & Central AsiaEurope & Central Asia (excluding high income)Europe & Central Asia (IDA & IBRD countries)European UnionFaroe IslandsFijiFinlandFragile and conflict affected situationsFranceFrench PolynesiaGabonGambia, TheGeorgiaGermanyGhanaGreeceGrenadaGuatemalaGuineaGuinea-BissauGuyanaHaitiHeavily indebted poor countries (HIPC)High incomeHondurasHong Kong SAR, ChinaHungaryIBRD onlyIcelandIDA & IBRD totalIDA blendIDA onlyIDA totalIndiaIndonesiaIran, Islamic Rep.IraqIrelandIsraelItalyJamaicaJapanJordanKazakhstanKenyaKiribatiKorea, Rep.KosovoKuwaitKyrgyz RepublicLao PDRLate-demographic dividendLatin America & Caribbean Latin America & Caribbean (excluding high income)Latin America & the Caribbean (IDA & IBRD countries)LatviaLeast developed countries: UN classificationLebanonLesothoLiberiaLibyaLithuaniaLow & middle incomeLow incomeLower middle incomeLuxembourgMacao SAR, ChinaMacedonia, FYRMadagascarMalawiMalaysiaMaldivesMaliMaltaMarshall IslandsMauritaniaMauritiusMexicoMicronesia, Fed. Sts.Middle East & North AfricaMiddle East & North Africa (excluding high income)Middle East & North Africa (IDA & IBRD countries)Middle incomeMoldovaMongoliaMontenegroMoroccoMozambiqueMyanmarNamibiaNepalNetherlandsNew CaledoniaNew ZealandNicaraguaNigerNigeriaNorth AmericaNorwayOECD membersOmanOther small statesPacific island small statesPakistanPalauPanamaPapua New GuineaParaguayPeruPhilippinesPolandPortugalPost-demographic dividendPre-demographic dividendQatarRomaniaRussian FederationRwandaSamoaSao Tome and PrincipeSaudi ArabiaSenegalSerbiaSeychellesSierra LeoneSint Maarten (Dutch part)Slovak RepublicSloveniaSmall statesSolomon IslandsSomaliaSouth AfricaSouth AsiaSouth Asia (IDA & IBRD)South SudanSpainSri LankaSt. Kitts and NevisSt. LuciaSt. Vincent and the GrenadinesSub-Saharan Africa Sub-Saharan Africa (excluding high income)Sub-Saharan Africa (IDA & IBRD countries)SudanSurinameSwazilandSwedenSwitzerlandSyrian Arab RepublicTajikistanTanzaniaThailandTimor-LesteTogoTongaTrinidad and TobagoTunisiaTurkeyTurkmenistanTuvaluUgandaUkraineUnited KingdomUnited StatesUpper middle incomeUruguayUzbekistanVanuatuVenezuela, RBVietnamWest Bank and GazaWorldYemen, Rep.ZambiaZimbabwe La ligne de temps
Cette échelle de temps montre un graphique de 1978 année à 2016 année Ethiopia. Les données jusqu'à 1977 année ne sont pas présentés. Quantité d'observations actuelles selon dates: 39.
Source (désignation):
Les indicateurs du développement mondiale
Source (organisation):
World Bank staff estimates based on IMF balance of payments data.
Catégories:
Economy & Growth, Financial Sector, External Debt
Dernière mise à jour
23 avr. 2017
Les indicateurs de changement de valeurs selon les années
Minimum:
4.444 mln.
1 janv. 1978
Maximum:
624.371 mln.
1 janv. 2014
Pour la date d''observation
Valeur
Changement absolu
Le changement par rapport à la valeur précédente
1 janv. 1978
4.444 mln.
+4.444 mln.
0.0%
1 janv. 1979
7.15 mln.
+2.705 mln.
60.87%
1 janv. 1980
8.696 mln.
+1.546 mln.
21.62%
1 janv. 1981
12.222 mln.
+3.527 mln.
40.56%
1 janv. 1982
10.483 mln.
-1.739 mln.
-14.23%
1 janv. 1983
10.193 mln.
-289.855 milles
-2.76%
1 janv. 1984
11.014 mln.
+821.257 milles
8.06%
1 janv. 1985
11.498 mln.
+483.091 milles
4.39%
1 janv. 1986
14.203 mln.
+2.705 mln.
23.53%
1 janv. 1987
13.575 mln.
-628.019 milles
-4.42%
1 janv. 1988
8.551 mln.
-5.024 mln.
-37.01%
1 janv. 1989
11.304 mln.
+2.754 mln.
32.2%
1 janv. 1990
6.473 mln.
-4.831 mln.
-42.74%
1 janv. 1991
5.217 mln.
-1.256 mln.
-19.4%
1 janv. 1992
9.758 mln.
+4.541 mln.
87.04%
1 janv. 1993
15.019 mln.
+5.261 mln.
53.91%
1 janv. 1994
18.38 mln.
+3.361 mln.
22.38%
1 janv. 1995
24.626 mln.
+6.246 mln.
33.98%
1 janv. 1996
27.36 mln.
+2.734 mln.
11.1%
1 janv. 1997
16.012 mln.
-11.347 mln.
-41.48%
1 janv. 1998
9.232 mln.
-6.78 mln.
-42.34%
1 janv. 1999
27.313 mln.
+18.081 mln.
195.84%
1 janv. 2000
33.73 mln.
+6.416 mln.
23.49%
1 janv. 2001
53.159 mln.
+19.429 mln.
57.6%
1 janv. 2002
18.314 mln.
-34.845 mln.
-65.55%
1 janv. 2003
32.987 mln.
+14.673 mln.
80.12%
1 janv. 2004
46.47 mln.
+13.483 mln.
40.87%
1 janv. 2005
133.743 mln.
+87.273 mln.
187.8%
1 janv. 2006
173.519 mln.
+39.777 mln.
29.74%
1 janv. 2007
172.153 mln.
-1.366 mln.
-0.79%
1 janv. 2008
357.838 mln.
+185.685 mln.
107.86%
1 janv. 2009
386.696 mln.
+28.858 mln.
8.06%
1 janv. 2010
261.602 mln.
-125.094 mln.
-32.35%
1 janv. 2011
345.151 mln.
+83.549 mln.
31.94%
1 janv. 2012
513.238 mln.
+168.087 mln.
48.7%
1 janv. 2013
624.361 mln.
+111.122 mln.
21.65%
1 janv. 2014
624.371 mln.
+10.496 milles
0.0%
1 janv. 2015
624.371 mln.
0.0
0.0%
1 janv. 2016
624.371 mln.
0.0
0.0%
Classement des pays selon les statistiques actuelles par années


Commentaires: