29
/fr/
fr
AIzaSyAYiBZKx7MnpbEhh9jyipgxe19OcubqV5w
April 1, 2024
161851
Italy
ITA
true
2
1
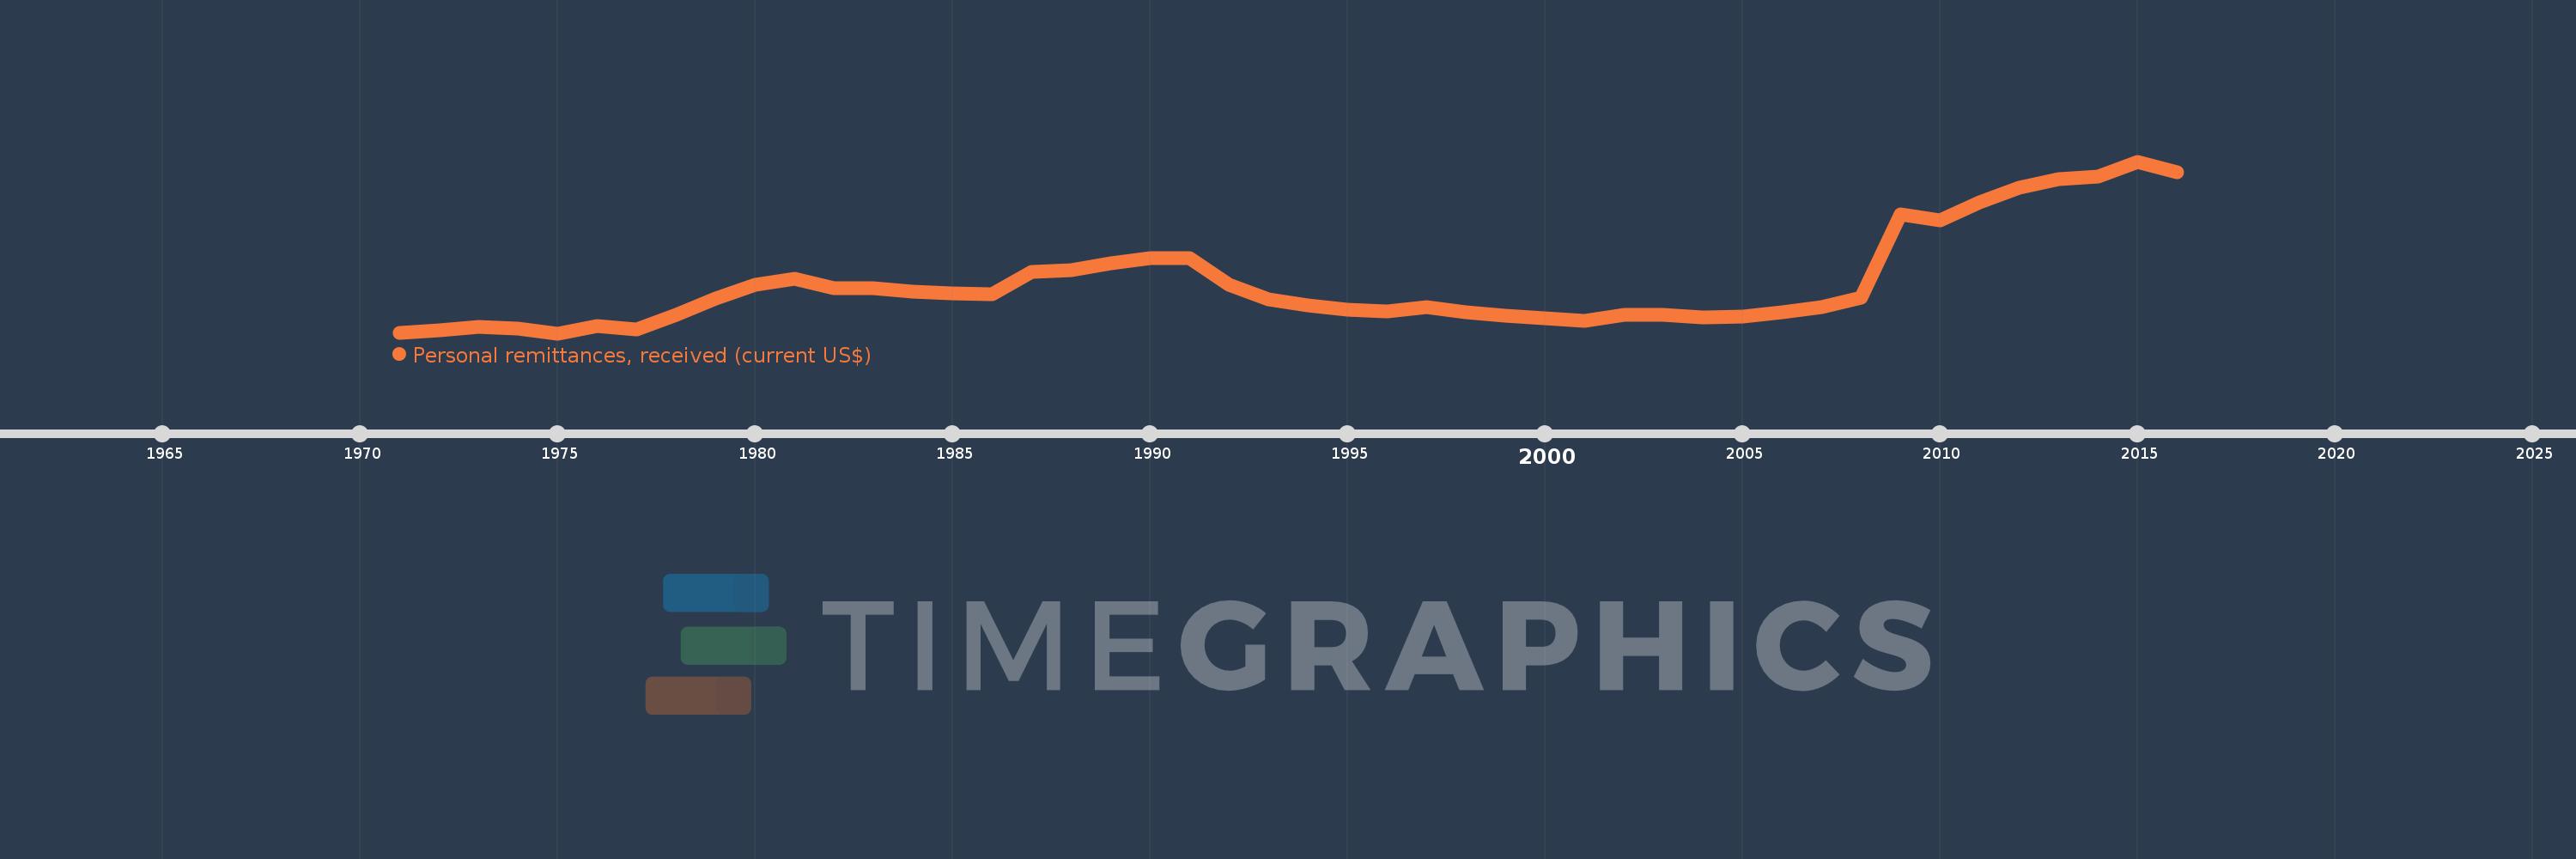
Personal remittances, received (current US$)
2016,2015,2014,2013,2012,2011,2010,2009,2008,2007,2006,2005,2004,2003,2002,2001,2000,1999,1998,1997,1996,1995,1994,1993,1992,1991,1990,1989,1988,1987,1986,1985,1984,1983,1982,1981,1980,1979,1978,1977,1976,1975,1974,1973,1972,1971
Cette statistique dans les autres pays:
AfghanistanAlbaniaAlgeriaAngolaAntigua and BarbudaArab WorldArgentinaArmeniaArubaAustraliaAustriaAzerbaijanBangladeshBarbadosBelarusBelgiumBelizeBeninBermudaBhutanBoliviaBosnia and HerzegovinaBotswanaBrazilBulgariaBurkina FasoBurundiCabo VerdeCambodiaCameroonCanadaCaribbean small statesCentral African RepublicCentral Europe and the BalticsChadChileChinaColombiaComorosCongo, Dem. Rep.Congo, Rep.Costa RicaCote d'IvoireCroatiaCuracaoCyprusCzech RepublicDenmarkDjiboutiDominicaDominican RepublicEarly-demographic dividendEast Asia & PacificEast Asia & Pacific (excluding high income)East Asia & Pacific (IDA & IBRD countries)EcuadorEgypt, Arab Rep.El SalvadorEquatorial GuineaEritreaEstoniaEthiopiaEuro areaEurope & Central AsiaEurope & Central Asia (excluding high income)Europe & Central Asia (IDA & IBRD countries)European UnionFaroe IslandsFijiFinlandFragile and conflict affected situationsFranceFrench PolynesiaGabonGambia, TheGeorgiaGermanyGhanaGreeceGrenadaGuatemalaGuineaGuinea-BissauGuyanaHaitiHeavily indebted poor countries (HIPC)High incomeHondurasHong Kong SAR, ChinaHungaryIBRD onlyIcelandIDA & IBRD totalIDA blendIDA onlyIDA totalIndiaIndonesiaIran, Islamic Rep.IraqIrelandIsraelItalyJamaicaJapanJordanKazakhstanKenyaKiribatiKorea, Rep.KosovoKuwaitKyrgyz RepublicLao PDRLate-demographic dividendLatin America & Caribbean Latin America & Caribbean (excluding high income)Latin America & the Caribbean (IDA & IBRD countries)LatviaLeast developed countries: UN classificationLebanonLesothoLiberiaLibyaLithuaniaLow & middle incomeLow incomeLower middle incomeLuxembourgMacao SAR, ChinaMacedonia, FYRMadagascarMalawiMalaysiaMaldivesMaliMaltaMarshall IslandsMauritaniaMauritiusMexicoMicronesia, Fed. Sts.Middle East & North AfricaMiddle East & North Africa (excluding high income)Middle East & North Africa (IDA & IBRD countries)Middle incomeMoldovaMongoliaMontenegroMoroccoMozambiqueMyanmarNamibiaNepalNetherlandsNew CaledoniaNew ZealandNicaraguaNigerNigeriaNorth AmericaNorwayOECD membersOmanOther small statesPacific island small statesPakistanPalauPanamaPapua New GuineaParaguayPeruPhilippinesPolandPortugalPost-demographic dividendPre-demographic dividendQatarRomaniaRussian FederationRwandaSamoaSao Tome and PrincipeSaudi ArabiaSenegalSerbiaSeychellesSierra LeoneSint Maarten (Dutch part)Slovak RepublicSloveniaSmall statesSolomon IslandsSomaliaSouth AfricaSouth AsiaSouth Asia (IDA & IBRD)South SudanSpainSri LankaSt. Kitts and NevisSt. LuciaSt. Vincent and the GrenadinesSub-Saharan Africa Sub-Saharan Africa (excluding high income)Sub-Saharan Africa (IDA & IBRD countries)SudanSurinameSwazilandSwedenSwitzerlandSyrian Arab RepublicTajikistanTanzaniaThailandTimor-LesteTogoTongaTrinidad and TobagoTunisiaTurkeyTurkmenistanTuvaluUgandaUkraineUnited KingdomUnited StatesUpper middle incomeUruguayUzbekistanVanuatuVenezuela, RBVietnamWest Bank and GazaWorldYemen, Rep.ZambiaZimbabwe La ligne de temps
Cette échelle de temps montre un graphique de 1971 année à 2016 année Italy. Les données jusqu'à 1970 année ne sont pas présentés. Quantité d'observations actuelles selon dates: 46.
Source (désignation):
Les indicateurs du développement mondiale
Source (organisation):
World Bank staff estimates based on IMF balance of payments data.
Catégories:
Economy & Growth, Financial Sector, External Debt
Dernière mise à jour
23 avr. 2017
Les indicateurs de changement de valeurs selon les années
Minimum:
1.214 mds
1 janv. 1975
Maximum:
10.087 mds
1 janv. 2015
Pour la date d''observation
Valeur
Changement absolu
Le changement par rapport à la valeur précédente
1 janv. 1971
1.232 mds
+1.232 mds
0.0%
1 janv. 1972
1.367 mds
+135.009 mln.
10.96%
1 janv. 1973
1.552 mds
+185.417 mln.
13.56%
1 janv. 1974
1.461 mds
-91.217 mln.
-5.88%
1 janv. 1975
1.214 mds
-246.831 mln.
-16.89%
1 janv. 1976
1.602 mds
+387.748 mln.
31.93%
1 janv. 1977
1.402 mds
-200.003 mln.
-12.48%
1 janv. 1978
2.162 mds
+760.329 mln.
54.23%
1 janv. 1979
2.997 mds
+834.165 mln.
38.57%
1 janv. 1980
3.699 mds
+702.048 mln.
23.43%
1 janv. 1981
4.013 mds
+314.551 mln.
8.5%
1 janv. 1982
3.532 mds
-481.387 mln.
-12.0%
1 janv. 1983
3.53 mds
-1.955 mln.
-0.06%
1 janv. 1984
3.381 mds
-149.282 mln.
-4.23%
1 janv. 1985
3.275 mds
-105.668 mln.
-3.13%
1 janv. 1986
3.231 mds
-44.409 mln.
-1.36%
1 janv. 1987
4.401 mds
+1.171 mds
36.24%
1 janv. 1988
4.463 mds
+61.507 mln.
1.4%
1 janv. 1989
4.83 mds
+366.943 mln.
8.22%
1 janv. 1990
5.08 mds
+250.843 mln.
5.19%
1 janv. 1991
5.075 mds
-5.93 mln.
-0.12%
1 janv. 1992
3.699 mds
-1.376 mds
-27.11%
1 janv. 1993
2.97 mds
-728.795 mln.
-19.7%
1 janv. 1994
2.671 mds
-299.543 mln.
-10.09%
1 janv. 1995
2.419 mds
-251.236 mln.
-9.41%
1 janv. 1996
2.364 mds
-55.666 mln.
-2.3%
1 janv. 1997
2.585 mds
+220.962 mln.
9.35%
1 janv. 1998
2.283 mds
-301.366 mln.
-11.66%
1 janv. 1999
2.115 mds
-167.825 mln.
-7.35%
1 janv. 2000
1.999 mds
-116.916 mln.
-5.53%
1 janv. 2001
1.87 mds
-128.755 mln.
-6.44%
1 janv. 2002
2.167 mds
+297.225 mln.
15.9%
1 janv. 2003
2.177 mds
+9.981 mln.
0.46%
1 janv. 2004
2.014 mds
-162.819 mln.
-7.48%
1 janv. 2005
2.092 mds
+77.619 mln.
3.85%
1 janv. 2006
2.318 mds
+226.296 mln.
10.82%
1 janv. 2007
2.556 mds
+237.735 mln.
10.26%
1 janv. 2008
3.063 mds
+507.037 mln.
19.84%
1 janv. 2009
7.355 mds
+4.292 mds
140.14%
1 janv. 2010
7.036 mds
-319.775 mln.
-4.35%
1 janv. 2011
7.977 mds
+941.499 mln.
13.38%
1 janv. 2012
8.726 mds
+748.551 mln.
9.38%
1 janv. 2013
9.169 mds
+443.875 mln.
5.09%
1 janv. 2014
9.328 mds
+158.096 mln.
1.72%
1 janv. 2015
10.087 mds
+759.122 mln.
8.14%
1 janv. 2016
9.517 mds
-569.674 mln.
-5.65%
Classement des pays selon les statistiques actuelles par années


Commentaires: