29
/fr/
fr
AIzaSyAYiBZKx7MnpbEhh9jyipgxe19OcubqV5w
April 1, 2024
191801
Malta
MLT
true
2
1
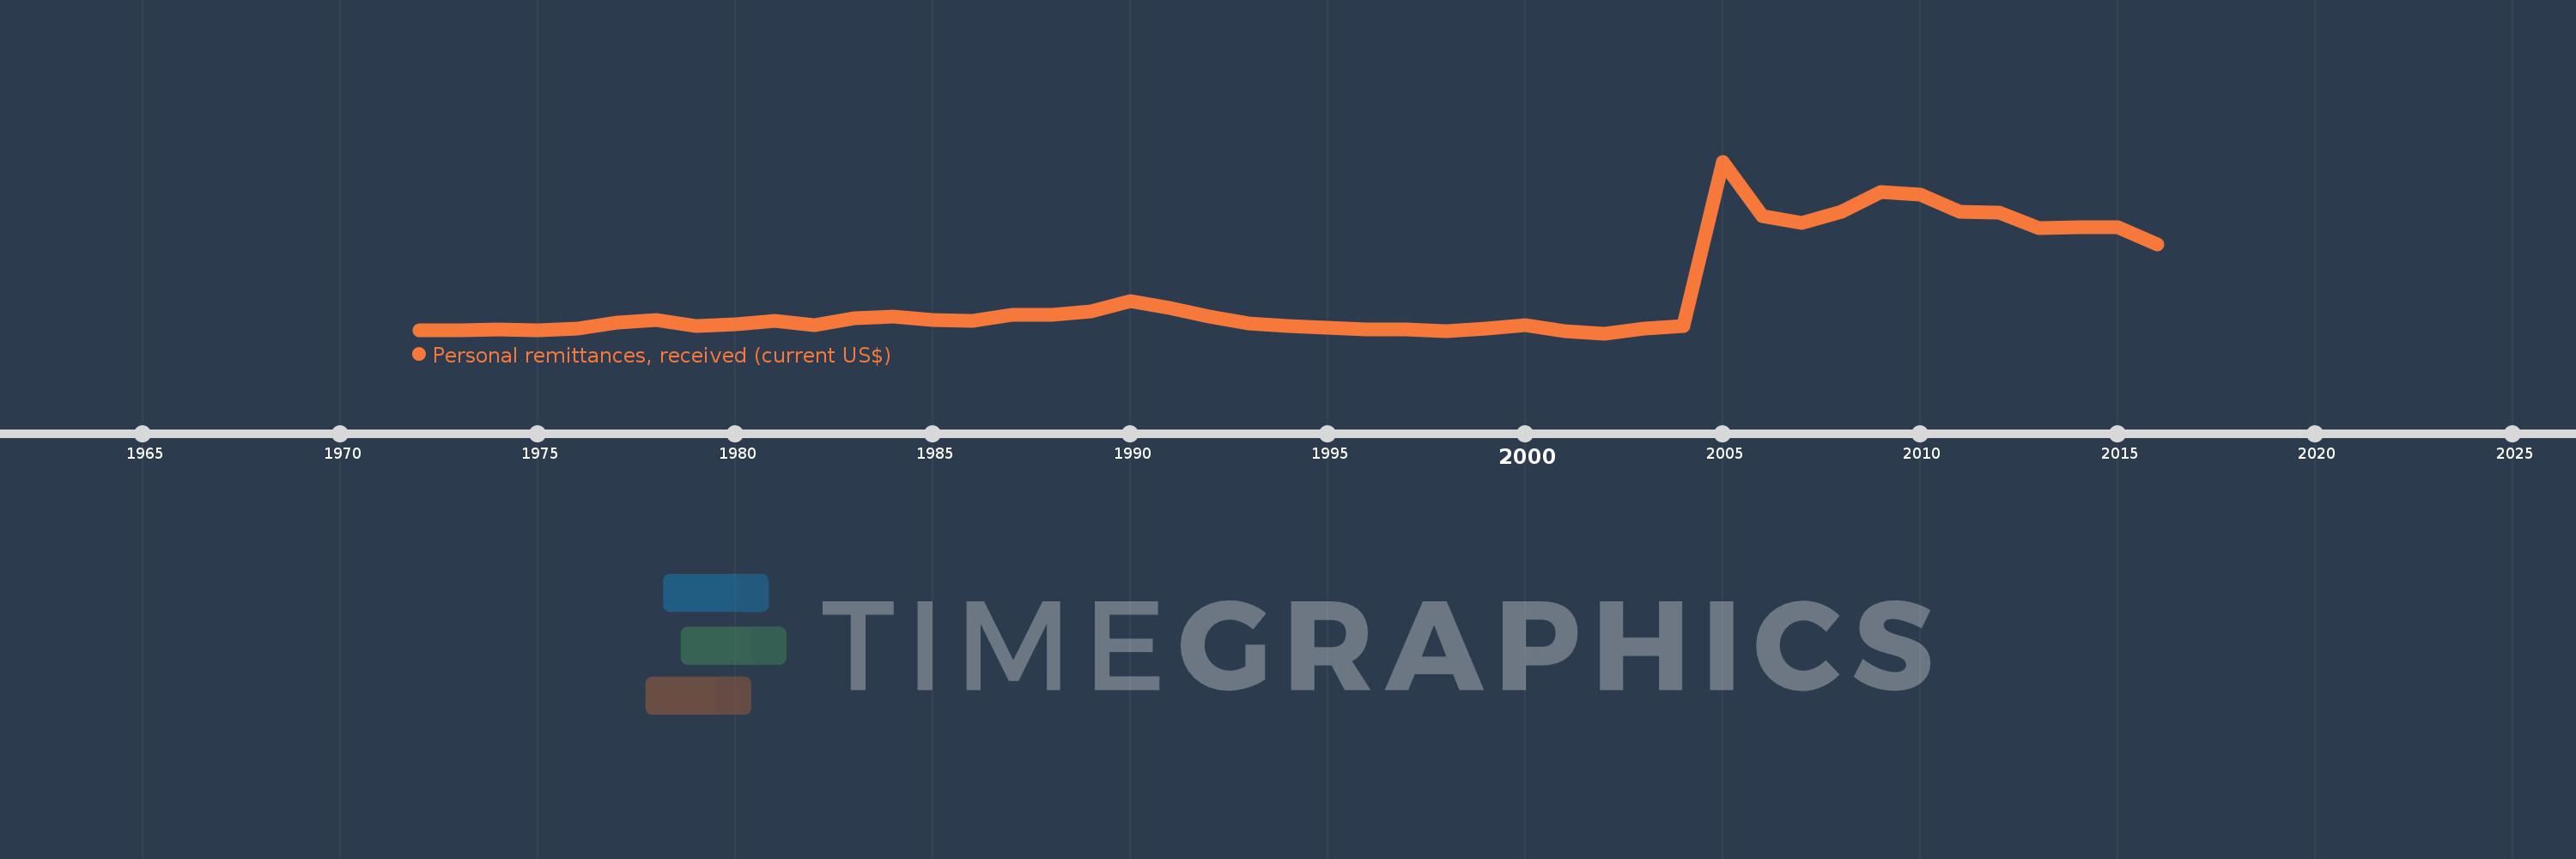
Personal remittances, received (current US$)
2016,2015,2014,2013,2012,2011,2010,2009,2008,2007,2006,2005,2004,2003,2002,2001,2000,1999,1998,1997,1996,1995,1994,1993,1992,1991,1990,1989,1988,1987,1986,1985,1984,1983,1982,1981,1980,1979,1978,1977,1976,1975,1974,1973,1972
Cette statistique dans les autres pays:
AfghanistanAlbaniaAlgeriaAngolaAntigua and BarbudaArab WorldArgentinaArmeniaArubaAustraliaAustriaAzerbaijanBangladeshBarbadosBelarusBelgiumBelizeBeninBermudaBhutanBoliviaBosnia and HerzegovinaBotswanaBrazilBulgariaBurkina FasoBurundiCabo VerdeCambodiaCameroonCanadaCaribbean small statesCentral African RepublicCentral Europe and the BalticsChadChileChinaColombiaComorosCongo, Dem. Rep.Congo, Rep.Costa RicaCote d'IvoireCroatiaCuracaoCyprusCzech RepublicDenmarkDjiboutiDominicaDominican RepublicEarly-demographic dividendEast Asia & PacificEast Asia & Pacific (excluding high income)East Asia & Pacific (IDA & IBRD countries)EcuadorEgypt, Arab Rep.El SalvadorEquatorial GuineaEritreaEstoniaEthiopiaEuro areaEurope & Central AsiaEurope & Central Asia (excluding high income)Europe & Central Asia (IDA & IBRD countries)European UnionFaroe IslandsFijiFinlandFragile and conflict affected situationsFranceFrench PolynesiaGabonGambia, TheGeorgiaGermanyGhanaGreeceGrenadaGuatemalaGuineaGuinea-BissauGuyanaHaitiHeavily indebted poor countries (HIPC)High incomeHondurasHong Kong SAR, ChinaHungaryIBRD onlyIcelandIDA & IBRD totalIDA blendIDA onlyIDA totalIndiaIndonesiaIran, Islamic Rep.IraqIrelandIsraelItalyJamaicaJapanJordanKazakhstanKenyaKiribatiKorea, Rep.KosovoKuwaitKyrgyz RepublicLao PDRLate-demographic dividendLatin America & Caribbean Latin America & Caribbean (excluding high income)Latin America & the Caribbean (IDA & IBRD countries)LatviaLeast developed countries: UN classificationLebanonLesothoLiberiaLibyaLithuaniaLow & middle incomeLow incomeLower middle incomeLuxembourgMacao SAR, ChinaMacedonia, FYRMadagascarMalawiMalaysiaMaldivesMaliMaltaMarshall IslandsMauritaniaMauritiusMexicoMicronesia, Fed. Sts.Middle East & North AfricaMiddle East & North Africa (excluding high income)Middle East & North Africa (IDA & IBRD countries)Middle incomeMoldovaMongoliaMontenegroMoroccoMozambiqueMyanmarNamibiaNepalNetherlandsNew CaledoniaNew ZealandNicaraguaNigerNigeriaNorth AmericaNorwayOECD membersOmanOther small statesPacific island small statesPakistanPalauPanamaPapua New GuineaParaguayPeruPhilippinesPolandPortugalPost-demographic dividendPre-demographic dividendQatarRomaniaRussian FederationRwandaSamoaSao Tome and PrincipeSaudi ArabiaSenegalSerbiaSeychellesSierra LeoneSint Maarten (Dutch part)Slovak RepublicSloveniaSmall statesSolomon IslandsSomaliaSouth AfricaSouth AsiaSouth Asia (IDA & IBRD)South SudanSpainSri LankaSt. Kitts and NevisSt. LuciaSt. Vincent and the GrenadinesSub-Saharan Africa Sub-Saharan Africa (excluding high income)Sub-Saharan Africa (IDA & IBRD countries)SudanSurinameSwazilandSwedenSwitzerlandSyrian Arab RepublicTajikistanTanzaniaThailandTimor-LesteTogoTongaTrinidad and TobagoTunisiaTurkeyTurkmenistanTuvaluUgandaUkraineUnited KingdomUnited StatesUpper middle incomeUruguayUzbekistanVanuatuVenezuela, RBVietnamWest Bank and GazaWorldYemen, Rep.ZambiaZimbabwe La ligne de temps
Cette échelle de temps montre un graphique de 1972 année à 2016 année Malta. Les données jusqu'à 1971 année ne sont pas présentés. Quantité d'observations actuelles selon dates: 45.
Source (désignation):
Les indicateurs du développement mondiale
Source (organisation):
World Bank staff estimates based on IMF balance of payments data.
Catégories:
Economy & Growth, Financial Sector, External Debt
Dernière mise à jour
23 avr. 2017
Les indicateurs de changement de valeurs selon les années
Minimum:
12.93 mln.
1 janv. 2002
Maximum:
318.675 mln.
1 janv. 2005
Pour la date d''observation
Valeur
Changement absolu
Le changement par rapport à la valeur précédente
1 janv. 1972
18.177 mln.
+18.177 mln.
0.0%
1 janv. 1973
17.821 mln.
-356.218 milles
-1.96%
1 janv. 1974
19.523 mln.
+1.702 mln.
9.55%
1 janv. 1975
18.678 mln.
-845.022 milles
-4.33%
1 janv. 1976
21.83 mln.
+3.153 mln.
16.88%
1 janv. 1977
32.225 mln.
+10.395 mln.
47.61%
1 janv. 1978
36.229 mln.
+4.004 mln.
12.43%
1 janv. 1979
26.467 mln.
-9.762 mln.
-26.95%
1 janv. 1980
28.733 mln.
+2.266 mln.
8.56%
1 janv. 1981
35.029 mln.
+6.296 mln.
21.91%
1 janv. 1982
28.187 mln.
-6.842 mln.
-19.53%
1 janv. 1983
39.307 mln.
+11.12 mln.
39.45%
1 janv. 1984
42.78 mln.
+3.473 mln.
8.84%
1 janv. 1985
36.874 mln.
-5.906 mln.
-13.81%
1 janv. 1986
34.743 mln.
-2.13 mln.
-5.78%
1 janv. 1987
45.802 mln.
+11.059 mln.
31.83%
1 janv. 1988
46.021 mln.
+218.967 milles
0.48%
1 janv. 1989
51.684 mln.
+5.663 mln.
12.3%
1 janv. 1990
70.016 mln.
+18.332 mln.
35.47%
1 janv. 1991
58.211 mln.
-11.804 mln.
-16.86%
1 janv. 1992
42.018 mln.
-16.193 mln.
-27.82%
1 janv. 1993
30.49 mln.
-11.528 mln.
-27.44%
1 janv. 1994
25.455 mln.
-5.036 mln.
-16.52%
1 janv. 1995
23.547 mln.
-1.907 mln.
-7.49%
1 janv. 1996
19.148 mln.
-4.399 mln.
-18.68%
1 janv. 1997
19.923 mln.
+774.22 milles
4.04%
1 janv. 1998
16.544 mln.
-3.378 mln.
-16.96%
1 janv. 1999
20.684 mln.
+4.14 mln.
25.02%
1 janv. 2000
27.167 mln.
+6.483 mln.
31.34%
1 janv. 2001
17.497 mln.
-9.67 mln.
-35.59%
1 janv. 2002
12.93 mln.
-4.567 mln.
-26.1%
1 janv. 2003
21.202 mln.
+8.272 mln.
63.97%
1 janv. 2004
25.795 mln.
+4.593 mln.
21.66%
1 janv. 2005
318.675 mln.
+292.88 mln.
1.14 milles%
1 janv. 2006
222.214 mln.
-96.461 mln.
-30.27%
1 janv. 2007
208.716 mln.
-13.498 mln.
-6.07%
1 janv. 2008
229.326 mln.
+20.61 mln.
9.87%
1 janv. 2009
264.489 mln.
+35.163 mln.
15.33%
1 janv. 2010
259.693 mln.
-4.796 mln.
-1.81%
1 janv. 2011
229.622 mln.
-30.071 mln.
-11.58%
1 janv. 2012
226.976 mln.
-2.646 mln.
-1.15%
1 janv. 2013
200.18 mln.
-26.796 mln.
-11.81%
1 janv. 2014
201.64 mln.
+1.46 mln.
0.73%
1 janv. 2015
201.741 mln.
+101.137 milles
0.05%
1 janv. 2016
171.245 mln.
-30.497 mln.
-15.12%
Classement des pays selon les statistiques actuelles par années


Commentaires: