29
/fr/
fr
AIzaSyAYiBZKx7MnpbEhh9jyipgxe19OcubqV5w
April 1, 2024
253462
Sudan
SDN
true
2
1
Personal remittances, received (current US$)
2016,2015,2014,2013,2012,2011,2010,2009,2008,2007,2006,2005,2004,2003,2002,2001,2000,1999,1998,1997,1996,1995,1994,1993,1992,1991,1990,1989,1988,1987,1986,1985,1984,1983,1982,1981,1980,1979,1978
Cette statistique dans les autres pays:
AfghanistanAlbaniaAlgeriaAngolaAntigua and BarbudaArab WorldArgentinaArmeniaArubaAustraliaAustriaAzerbaijanBangladeshBarbadosBelarusBelgiumBelizeBeninBermudaBhutanBoliviaBosnia and HerzegovinaBotswanaBrazilBulgariaBurkina FasoBurundiCabo VerdeCambodiaCameroonCanadaCaribbean small statesCentral African RepublicCentral Europe and the BalticsChadChileChinaColombiaComorosCongo, Dem. Rep.Congo, Rep.Costa RicaCote d'IvoireCroatiaCuracaoCyprusCzech RepublicDenmarkDjiboutiDominicaDominican RepublicEarly-demographic dividendEast Asia & PacificEast Asia & Pacific (excluding high income)East Asia & Pacific (IDA & IBRD countries)EcuadorEgypt, Arab Rep.El SalvadorEquatorial GuineaEritreaEstoniaEthiopiaEuro areaEurope & Central AsiaEurope & Central Asia (excluding high income)Europe & Central Asia (IDA & IBRD countries)European UnionFaroe IslandsFijiFinlandFragile and conflict affected situationsFranceFrench PolynesiaGabonGambia, TheGeorgiaGermanyGhanaGreeceGrenadaGuatemalaGuineaGuinea-BissauGuyanaHaitiHeavily indebted poor countries (HIPC)High incomeHondurasHong Kong SAR, ChinaHungaryIBRD onlyIcelandIDA & IBRD totalIDA blendIDA onlyIDA totalIndiaIndonesiaIran, Islamic Rep.IraqIrelandIsraelItalyJamaicaJapanJordanKazakhstanKenyaKiribatiKorea, Rep.KosovoKuwaitKyrgyz RepublicLao PDRLate-demographic dividendLatin America & Caribbean Latin America & Caribbean (excluding high income)Latin America & the Caribbean (IDA & IBRD countries)LatviaLeast developed countries: UN classificationLebanonLesothoLiberiaLibyaLithuaniaLow & middle incomeLow incomeLower middle incomeLuxembourgMacao SAR, ChinaMacedonia, FYRMadagascarMalawiMalaysiaMaldivesMaliMaltaMarshall IslandsMauritaniaMauritiusMexicoMicronesia, Fed. Sts.Middle East & North AfricaMiddle East & North Africa (excluding high income)Middle East & North Africa (IDA & IBRD countries)Middle incomeMoldovaMongoliaMontenegroMoroccoMozambiqueMyanmarNamibiaNepalNetherlandsNew CaledoniaNew ZealandNicaraguaNigerNigeriaNorth AmericaNorwayOECD membersOmanOther small statesPacific island small statesPakistanPalauPanamaPapua New GuineaParaguayPeruPhilippinesPolandPortugalPost-demographic dividendPre-demographic dividendQatarRomaniaRussian FederationRwandaSamoaSao Tome and PrincipeSaudi ArabiaSenegalSerbiaSeychellesSierra LeoneSint Maarten (Dutch part)Slovak RepublicSloveniaSmall statesSolomon IslandsSomaliaSouth AfricaSouth AsiaSouth Asia (IDA & IBRD)South SudanSpainSri LankaSt. Kitts and NevisSt. LuciaSt. Vincent and the GrenadinesSub-Saharan Africa Sub-Saharan Africa (excluding high income)Sub-Saharan Africa (IDA & IBRD countries)SudanSurinameSwazilandSwedenSwitzerlandSyrian Arab RepublicTajikistanTanzaniaThailandTimor-LesteTogoTongaTrinidad and TobagoTunisiaTurkeyTurkmenistanTuvaluUgandaUkraineUnited KingdomUnited StatesUpper middle incomeUruguayUzbekistanVanuatuVenezuela, RBVietnamWest Bank and GazaWorldYemen, Rep.ZambiaZimbabwe La ligne de temps
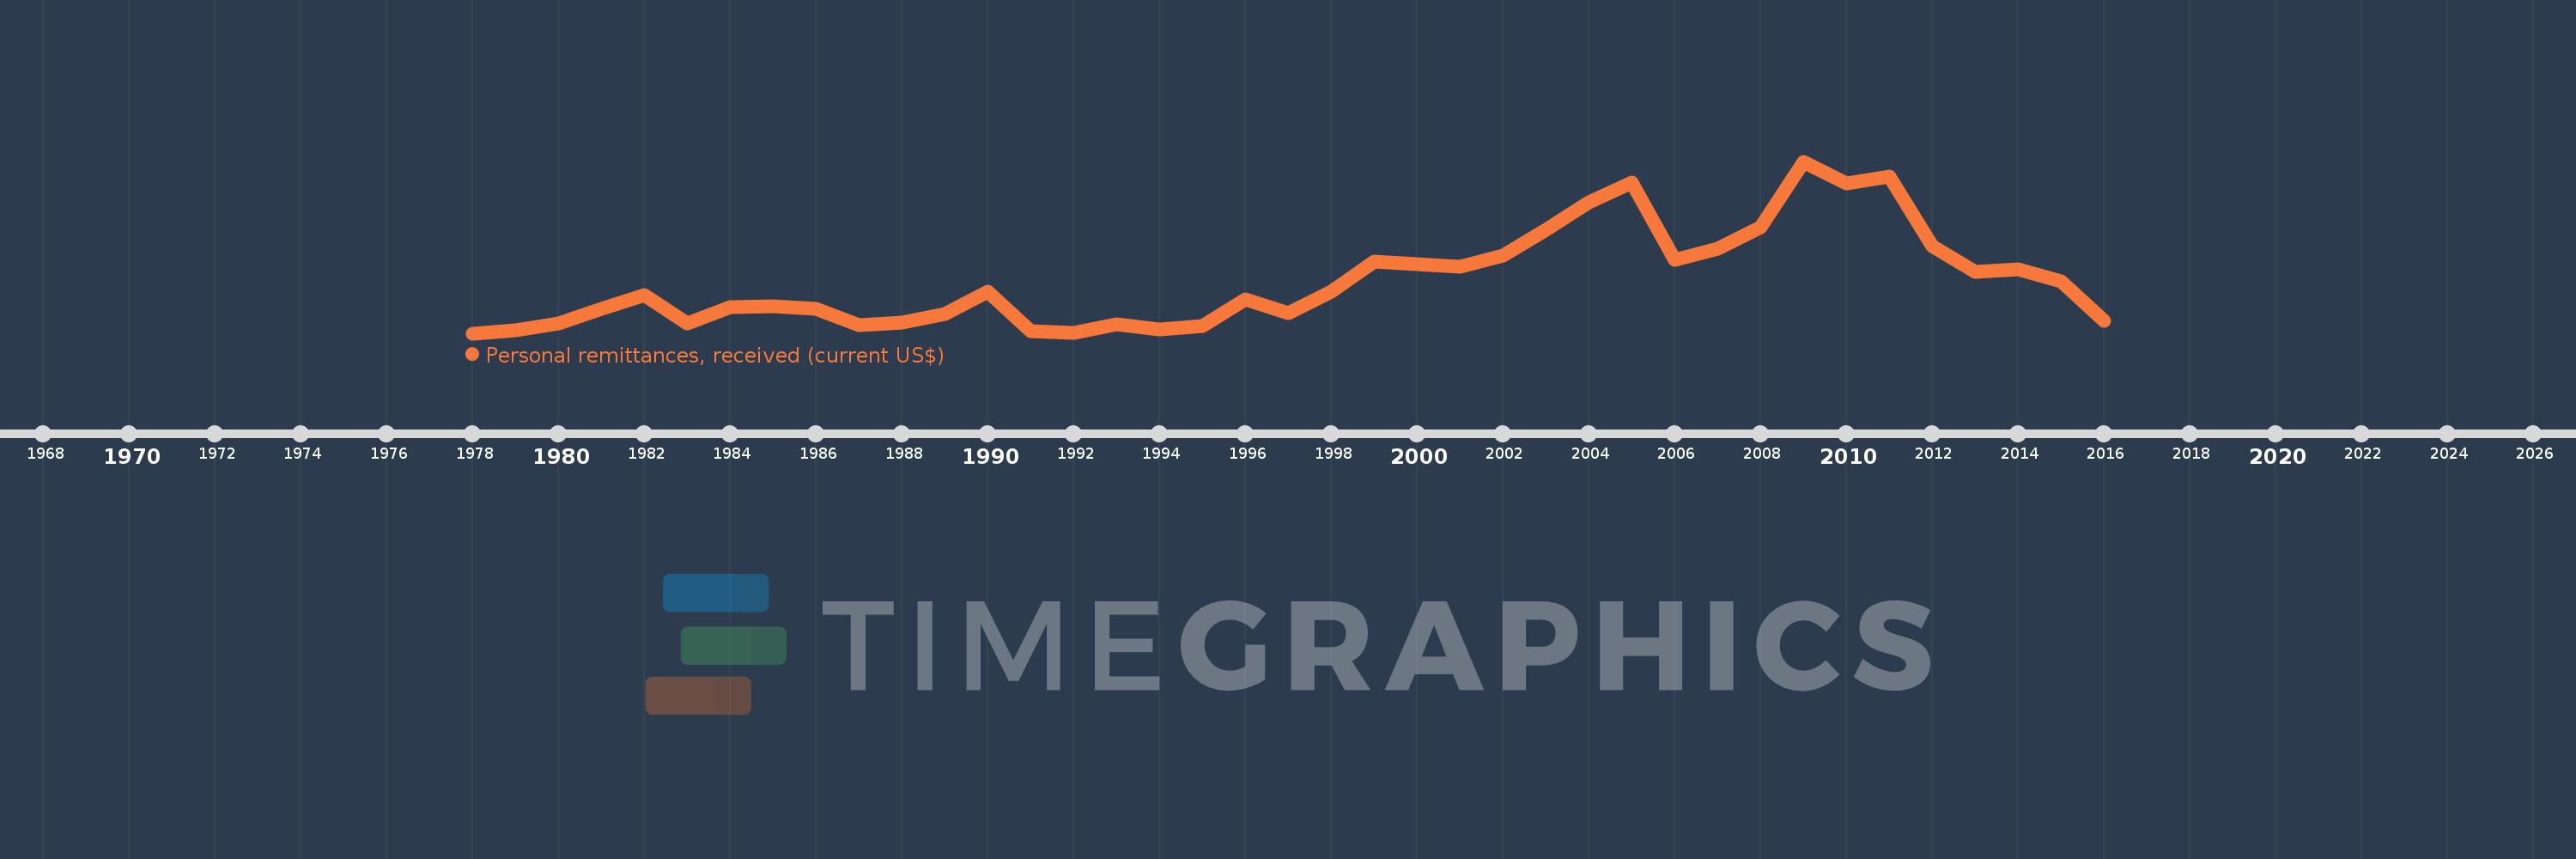
Cette échelle de temps montre un graphique de 1978 année à 2016 année Sudan. Les données jusqu'à 1977 année ne sont pas présentés. Quantité d'observations actuelles selon dates: 39.
Source (désignation):
Les indicateurs du développement mondiale
Source (organisation):
World Bank staff estimates based on IMF balance of payments data.
Catégories:
Economy & Growth, Financial Sector, External Debt
Dernière mise à jour
23 avr. 2017
Les indicateurs de changement de valeurs selon les années
Minimum:
40.493 mln.
1 janv. 1978
Maximum:
1.591 mds
1 janv. 2009
Pour la date d''observation
Valeur
Changement absolu
Le changement par rapport à la valeur précédente
1 janv. 1978
40.493 mln.
+40.493 mln.
0.0%
1 janv. 1979
68.978 mln.
+28.486 mln.
70.35%
1 janv. 1980
127.89 mln.
+58.912 mln.
85.41%
1 janv. 1981
262.2 mln.
+134.31 mln.
105.02%
1 janv. 1982
383.992 mln.
+121.792 mln.
46.45%
1 janv. 1983
133.111 mln.
-250.88 mln.
-65.33%
1 janv. 1984
274.462 mln.
+141.35 mln.
106.19%
1 janv. 1985
284.769 mln.
+10.308 mln.
3.76%
1 janv. 1986
260.808 mln.
-23.961 mln.
-8.41%
1 janv. 1987
113.32 mln.
-147.488 mln.
-56.55%
1 janv. 1988
137.818 mln.
+24.498 mln.
21.62%
1 janv. 1989
217.356 mln.
+79.538 mln.
57.71%
1 janv. 1990
416.733 mln.
+199.378 mln.
91.73%
1 janv. 1991
61.9 mln.
-354.833 mln.
-85.15%
1 janv. 1992
45.4 mln.
-16.5 mln.
-26.66%
1 janv. 1993
123.7 mln.
+78.3 mln.
172.47%
1 janv. 1994
75.2 mln.
-48.5 mln.
-39.21%
1 janv. 1995
107.2 mln.
+32.0 mln.
42.55%
1 janv. 1996
346.2 mln.
+239.0 mln.
222.95%
1 janv. 1997
221.52 mln.
-124.68 mln.
-36.01%
1 janv. 1998
419.6 mln.
+198.08 mln.
89.42%
1 janv. 1999
686.6 mln.
+267.0 mln.
63.63%
1 janv. 2000
665.1 mln.
-21.5 mln.
-3.13%
1 janv. 2001
640.8 mln.
-24.3 mln.
-3.65%
1 janv. 2002
739.6 mln.
+98.8 mln.
15.42%
1 janv. 2003
977.69 mln.
+238.09 mln.
32.19%
1 janv. 2004
1.224 mds
+245.91 mln.
25.15%
1 janv. 2005
1.403 mds
+179.35 mln.
14.66%
1 janv. 2006
703.788 mln.
-699.162 mln.
-49.84%
1 janv. 2007
800.829 mln.
+97.04 mln.
13.79%
1 janv. 2008
999.711 mln.
+198.882 mln.
24.83%
1 janv. 2009
1.591 mds
+590.915 mln.
59.11%
1 janv. 2010
1.394 mds
-196.23 mln.
-12.34%
1 janv. 2011
1.456 mds
+61.142 mln.
4.38%
1 janv. 2012
824.221 mln.
-631.316 mln.
-43.37%
1 janv. 2013
595.843 mln.
-228.378 mln.
-27.71%
1 janv. 2014
619.509 mln.
+23.666 mln.
3.97%
1 janv. 2015
506.557 mln.
-112.952 mln.
-18.23%
1 janv. 2016
151.392 mln.
-355.165 mln.
-70.11%
Classement des pays selon les statistiques actuelles par années


Commentaires: