29
/fr/
fr
AIzaSyAYiBZKx7MnpbEhh9jyipgxe19OcubqV5w
April 1, 2024
27609
East Asia & Pacific
EAS
false
2
1
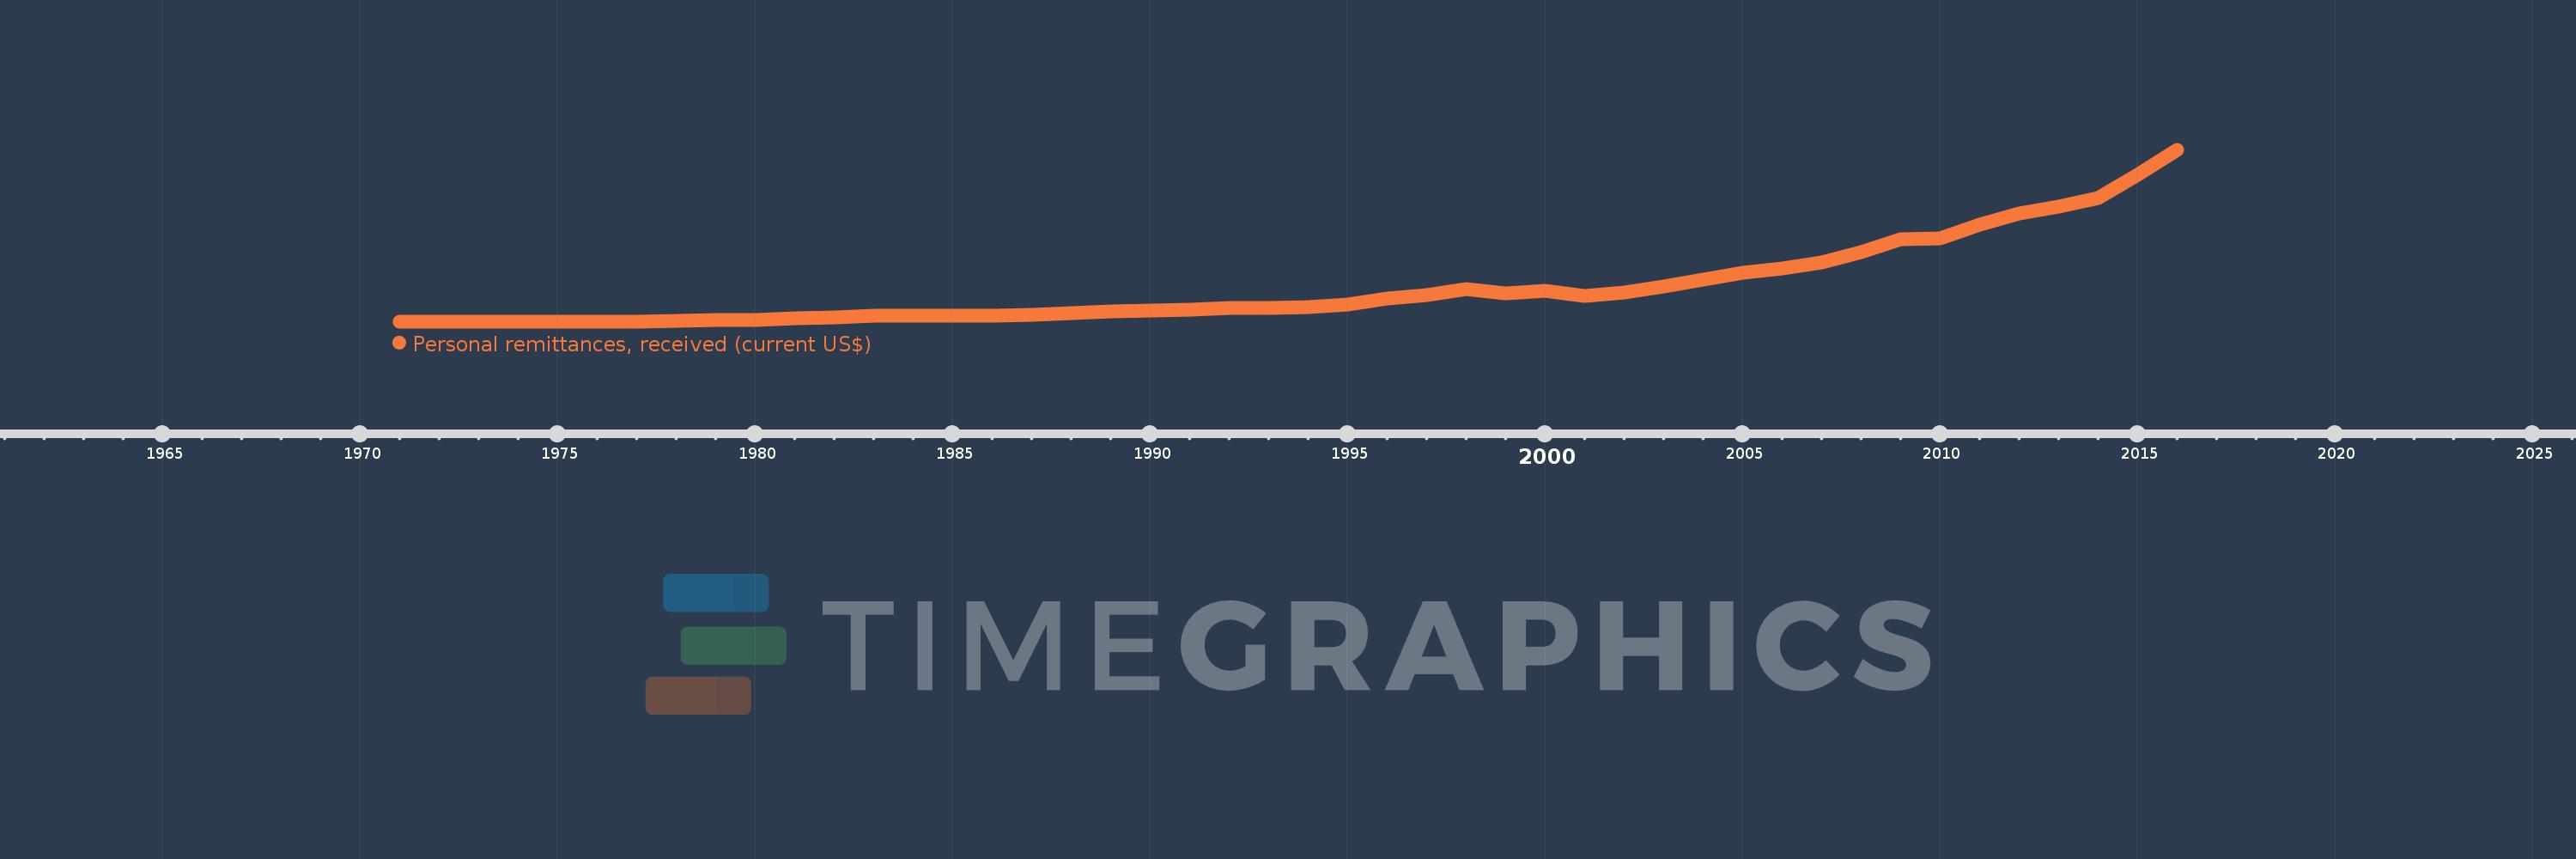
Personal remittances, received (current US$)
2016,2015,2014,2013,2012,2011,2010,2009,2008,2007,2006,2005,2004,2003,2002,2001,2000,1999,1998,1997,1996,1995,1994,1993,1992,1991,1990,1989,1988,1987,1986,1985,1984,1983,1982,1981,1980,1979,1978,1977,1976,1975,1974,1973,1972,1971
Cette statistique dans les autres pays:
AfghanistanAlbaniaAlgeriaAngolaAntigua and BarbudaArab WorldArgentinaArmeniaArubaAustraliaAustriaAzerbaijanBangladeshBarbadosBelarusBelgiumBelizeBeninBermudaBhutanBoliviaBosnia and HerzegovinaBotswanaBrazilBulgariaBurkina FasoBurundiCabo VerdeCambodiaCameroonCanadaCaribbean small statesCentral African RepublicCentral Europe and the BalticsChadChileChinaColombiaComorosCongo, Dem. Rep.Congo, Rep.Costa RicaCote d'IvoireCroatiaCuracaoCyprusCzech RepublicDenmarkDjiboutiDominicaDominican RepublicEarly-demographic dividendEast Asia & PacificEast Asia & Pacific (excluding high income)East Asia & Pacific (IDA & IBRD countries)EcuadorEgypt, Arab Rep.El SalvadorEquatorial GuineaEritreaEstoniaEthiopiaEuro areaEurope & Central AsiaEurope & Central Asia (excluding high income)Europe & Central Asia (IDA & IBRD countries)European UnionFaroe IslandsFijiFinlandFragile and conflict affected situationsFranceFrench PolynesiaGabonGambia, TheGeorgiaGermanyGhanaGreeceGrenadaGuatemalaGuineaGuinea-BissauGuyanaHaitiHeavily indebted poor countries (HIPC)High incomeHondurasHong Kong SAR, ChinaHungaryIBRD onlyIcelandIDA & IBRD totalIDA blendIDA onlyIDA totalIndiaIndonesiaIran, Islamic Rep.IraqIrelandIsraelItalyJamaicaJapanJordanKazakhstanKenyaKiribatiKorea, Rep.KosovoKuwaitKyrgyz RepublicLao PDRLate-demographic dividendLatin America & Caribbean Latin America & Caribbean (excluding high income)Latin America & the Caribbean (IDA & IBRD countries)LatviaLeast developed countries: UN classificationLebanonLesothoLiberiaLibyaLithuaniaLow & middle incomeLow incomeLower middle incomeLuxembourgMacao SAR, ChinaMacedonia, FYRMadagascarMalawiMalaysiaMaldivesMaliMaltaMarshall IslandsMauritaniaMauritiusMexicoMicronesia, Fed. Sts.Middle East & North AfricaMiddle East & North Africa (excluding high income)Middle East & North Africa (IDA & IBRD countries)Middle incomeMoldovaMongoliaMontenegroMoroccoMozambiqueMyanmarNamibiaNepalNetherlandsNew CaledoniaNew ZealandNicaraguaNigerNigeriaNorth AmericaNorwayOECD membersOmanOther small statesPacific island small statesPakistanPalauPanamaPapua New GuineaParaguayPeruPhilippinesPolandPortugalPost-demographic dividendPre-demographic dividendQatarRomaniaRussian FederationRwandaSamoaSao Tome and PrincipeSaudi ArabiaSenegalSerbiaSeychellesSierra LeoneSint Maarten (Dutch part)Slovak RepublicSloveniaSmall statesSolomon IslandsSomaliaSouth AfricaSouth AsiaSouth Asia (IDA & IBRD)South SudanSpainSri LankaSt. Kitts and NevisSt. LuciaSt. Vincent and the GrenadinesSub-Saharan Africa Sub-Saharan Africa (excluding high income)Sub-Saharan Africa (IDA & IBRD countries)SudanSurinameSwazilandSwedenSwitzerlandSyrian Arab RepublicTajikistanTanzaniaThailandTimor-LesteTogoTongaTrinidad and TobagoTunisiaTurkeyTurkmenistanTuvaluUgandaUkraineUnited KingdomUnited StatesUpper middle incomeUruguayUzbekistanVanuatuVenezuela, RBVietnamWest Bank and GazaWorldYemen, Rep.ZambiaZimbabwe La ligne de temps
Cette échelle de temps montre un graphique de 1971 année à 2016 année East Asia & Pacific. Les données jusqu'à 1970 année ne sont pas présentés. Quantité d'observations actuelles selon dates: 46.
Source (désignation):
Les indicateurs du développement mondiale
Source (organisation):
World Bank staff estimates based on IMF balance of payments data.
Catégories:
Economy & Growth, Financial Sector, External Debt
Dernière mise à jour
23 avr. 2017
Les indicateurs de changement de valeurs selon les années
Minimum:
176.84 mln.
1 janv. 1972
Maximum:
120.967 mds
1 janv. 2016
Pour la date d''observation
Valeur
Changement absolu
Le changement par rapport à la valeur précédente
1 janv. 1971
180.32 mln.
+180.32 mln.
0.0%
1 janv. 1972
176.84 mln.
-3.48 mln.
-1.93%
1 janv. 1973
337.135 mln.
+160.295 mln.
90.64%
1 janv. 1974
438.695 mln.
+101.56 mln.
30.12%
1 janv. 1975
475.42 mln.
+36.725 mln.
8.37%
1 janv. 1976
473.33 mln.
-2.089 mln.
-0.44%
1 janv. 1977
526.952 mln.
+53.622 mln.
11.33%
1 janv. 1978
1.072 mds
+544.609 mln.
103.35%
1 janv. 1979
1.388 mds
+316.541 mln.
29.54%
1 janv. 1980
1.747 mds
+359.223 mln.
25.88%
1 janv. 1981
2.637 mds
+890.168 mln.
50.94%
1 janv. 1982
3.201 mds
+563.954 mln.
21.38%
1 janv. 1983
4.398 mds
+1.197 mds
37.38%
1 janv. 1984
4.882 mds
+483.472 mln.
10.99%
1 janv. 1985
4.517 mds
-364.648 mln.
-7.47%
1 janv. 1986
4.534 mds
+16.76 mln.
0.37%
1 janv. 1987
5.369 mds
+834.72 mln.
18.41%
1 janv. 1988
6.194 mds
+825.149 mln.
15.37%
1 janv. 1989
7.708 mds
+1.514 mds
24.45%
1 janv. 1990
8.089 mds
+381.566 mln.
4.95%
1 janv. 1991
8.654 mds
+565.034 mln.
6.98%
1 janv. 1992
9.962 mds
+1.308 mds
15.11%
1 janv. 1993
10.166 mds
+204.027 mln.
2.05%
1 janv. 1994
10.618 mds
+451.504 mln.
4.44%
1 janv. 1995
12.726 mds
+2.108 mds
19.86%
1 janv. 1996
16.876 mds
+4.15 mds
32.61%
1 janv. 1997
18.891 mds
+2.016 mds
11.94%
1 janv. 1998
23.494 mds
+4.602 mds
24.36%
1 janv. 1999
20.284 mds
-3.21 mds
-13.66%
1 janv. 2000
21.884 mds
+1.6 mds
7.89%
1 janv. 2001
18.731 mds
-3.153 mds
-14.41%
1 janv. 2002
20.807 mds
+2.075 mds
11.08%
1 janv. 2003
25.301 mds
+4.495 mds
21.6%
1 janv. 2004
29.959 mds
+4.658 mds
18.41%
1 janv. 2005
34.669 mds
+4.709 mds
15.72%
1 janv. 2006
37.612 mds
+2.944 mds
8.49%
1 janv. 2007
41.794 mds
+4.181 mds
11.12%
1 janv. 2008
49.52 mds
+7.726 mds
18.49%
1 janv. 2009
58.082 mds
+8.562 mds
17.29%
1 janv. 2010
58.796 mds
+714.067 mln.
1.23%
1 janv. 2011
68.383 mds
+9.587 mds
16.31%
1 janv. 2012
76.251 mds
+7.868 mds
11.51%
1 janv. 2013
81.137 mds
+4.886 mds
6.41%
1 janv. 2014
87.371 mds
+6.234 mds
7.68%
1 janv. 2015
103.668 mds
+16.297 mds
18.65%
1 janv. 2016
120.967 mds
+17.299 mds
16.69%
Classement des pays selon les statistiques actuelles par années


Commentaires: