29
/es/
es
AIzaSyAYiBZKx7MnpbEhh9jyipgxe19OcubqV5w
April 1, 2024
91225
Brazil
BRA
true
2
1
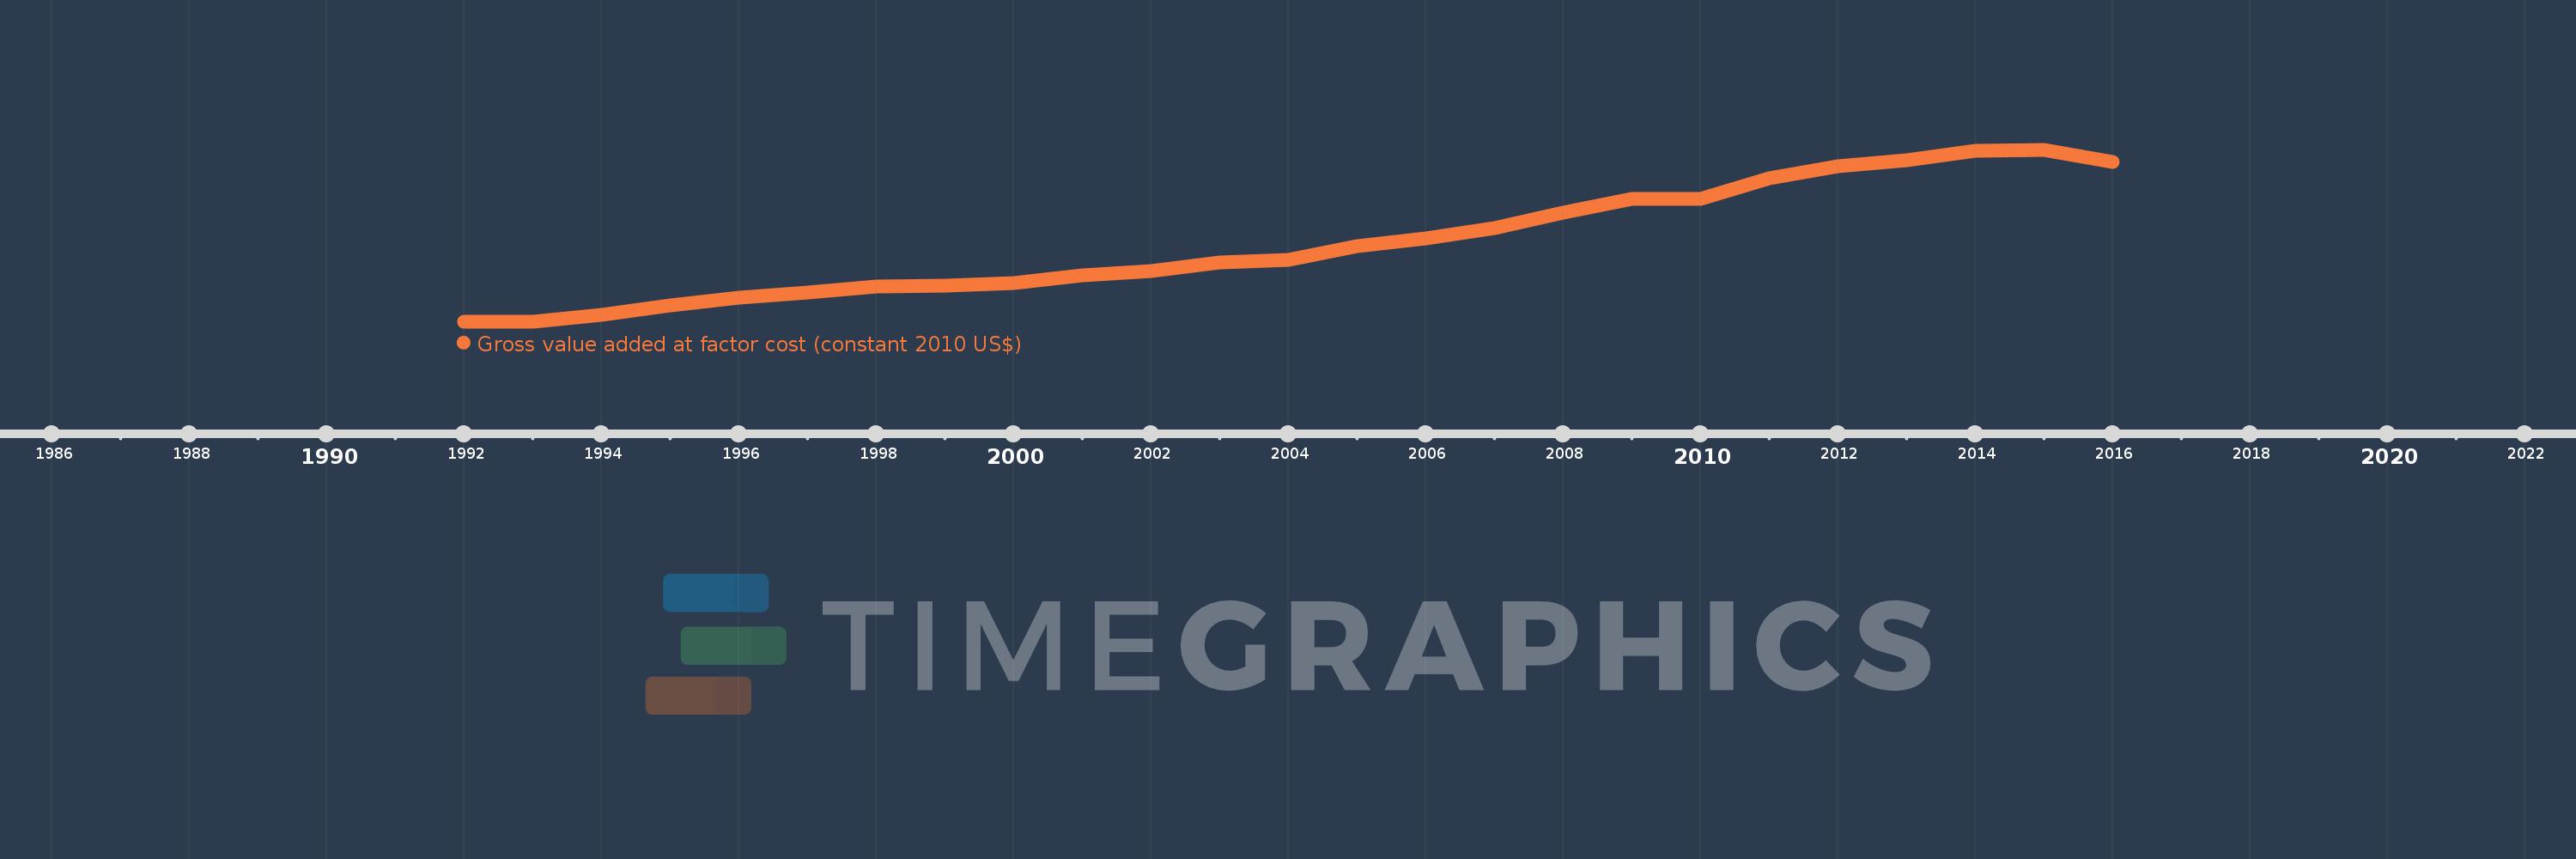
Gross value added at factor cost (constant 2010 US$)
2016,2015,2014,2013,2012,2011,2010,2009,2008,2007,2006,2005,2004,2003,2002,2001,2000,1999,1998,1997,1996,1995,1994,1993,1992
Estas estadísticas en otros países:
AfghanistanAlbaniaAlgeriaAndorraAntigua and BarbudaArgentinaArmeniaArubaAustraliaAustriaAzerbaijanBahamas, TheBangladeshBarbadosBelarusBelgiumBelizeBeninBermudaBhutanBoliviaBosnia and HerzegovinaBotswanaBrazilBulgariaBurkina FasoBurundiCabo VerdeCambodiaCameroonCanadaCaribbean small statesCentral African RepublicCentral Europe and the BalticsChadChileColombiaCongo, Dem. Rep.Costa RicaCroatiaCubaCyprusCzech RepublicDenmarkDominicaDominican RepublicEarly-demographic dividendEcuadorEgypt, Arab Rep.El SalvadorEquatorial GuineaEstoniaEthiopiaEuro areaEurope & Central AsiaEurope & Central Asia (excluding high income)Europe & Central Asia (IDA & IBRD countries)European UnionFaroe IslandsFijiFinlandFranceGabonGambia, TheGeorgiaGermanyGhanaGreeceGrenadaGuatemalaGuineaGuinea-BissauGuyanaHeavily indebted poor countries (HIPC)High incomeHondurasHong Kong SAR, ChinaHungaryIcelandIDA blendIDA onlyIDA totalIndiaIndonesiaIran, Islamic Rep.IrelandItalyJamaicaJapanJordanKazakhstanKenyaKiribatiKorea, Rep.KosovoKuwaitKyrgyz RepublicLao PDRLatin America & Caribbean Latin America & Caribbean (excluding high income)Latin America & the Caribbean (IDA & IBRD countries)LatviaLeast developed countries: UN classificationLebanonLesothoLiechtensteinLithuaniaLow incomeLower middle incomeLuxembourgMacao SAR, ChinaMacedonia, FYRMadagascarMalawiMaldivesMaliMaltaMarshall IslandsMauritaniaMauritiusMexicoMicronesia, Fed. Sts.Middle East & North Africa (excluding high income)Middle East & North Africa (IDA & IBRD countries)MoldovaMongoliaMontenegroMoroccoMozambiqueNamibiaNepalNetherlandsNew ZealandNicaraguaNigeriaNorth AmericaNorwayOECD membersPacific island small statesPakistanPalauPanamaParaguayPeruPolandPortugalPost-demographic dividendPre-demographic dividendRomaniaRussian FederationRwandaSao Tome and PrincipeSenegalSerbiaSeychellesSierra LeoneSingaporeSlovak RepublicSloveniaSouth AfricaSouth AsiaSouth Asia (IDA & IBRD)SpainSri LankaSt. Kitts and NevisSt. LuciaSt. Vincent and the GrenadinesSub-Saharan Africa Sub-Saharan Africa (excluding high income)Sub-Saharan Africa (IDA & IBRD countries)SudanSurinameSwazilandSwedenSwitzerlandTajikistanTanzaniaThailandTimor-LesteTongaTrinidad and TobagoTunisiaTurkeyTurkmenistanTuvaluUgandaUkraineUnited KingdomUnited StatesUruguayUzbekistanVanuatuVenezuela, RBVietnamWest Bank and GazaWorldZambiaZimbabwe línea de tiempo (timeline):
En esta escala de tiempo se presenta un gráfico de 1992 y 2016 de Brazil. Los datos de 1991 están ausentes. El número de observaciones reales por fecha: 25.
Fuente (nombre):
Indicadores del desarrollo mundial
Fuente (organización):
World Bank national accounts data, and OECD National Accounts data files.
Categorías:
Economy & Growth
Se ha actualizado:
23 abr 2017 año
Los indicadores de los cambios de valor en los últimos años
En promedio:
1.504 billones
Mínimo:
1.047 billones
1 ene 1993 año
Máximo:
2.037 billones
1 ene 2015 año
A la fecha de observación
Valor
Cambio absoluto
El cambio con respecto al valor anterior
1 ene 1992 año
1.049 billones
+1.049 billones
0.0%
1 ene 1993 año
1.047 billones
-2.255 bn
-0.21%
1 ene 1994 año
1.09 billones
+43.394 bn
4.15%
1 ene 1995 año
1.144 billones
+54.325 bn
4.98%
1 ene 1996 año
1.185 billones
+40.731 bn
3.56%
1 ene 1997 año
1.215 billones
+30.26 bn
2.55%
1 ene 1998 año
1.251 billones
+35.397 bn
2.91%
1 ene 1999 año
1.259 billones
+7.806 bn
0.62%
1 ene 2000 año
1.271 billones
+12.097 bn
0.96%
1 ene 2001 año
1.317 billones
+46.128 bn
3.63%
1 ene 2002 año
1.341 billones
+23.802 bn
1.81%
1 ene 2003 año
1.389 billones
+47.941 bn
3.58%
1 ene 2004 año
1.406 billones
+17.043 bn
1.23%
1 ene 2005 año
1.485 billones
+79.524 bn
5.66%
1 ene 2006 año
1.53 billones
+44.753 bn
3.01%
1 ene 2007 año
1.586 billones
+56.403 bn
3.69%
1 ene 2008 año
1.678 billones
+92.008 bn
5.8%
1 ene 2009 año
1.757 billones
+78.481 bn
4.68%
1 ene 2010 año
1.755 billones
-1.698 bn
-0.1%
1 ene 2011 año
1.877 billones
+122.399 bn
6.97%
1 ene 2012 año
1.946 billones
+68.887 bn
3.67%
1 ene 2013 año
1.978 billones
+31.255 bn
1.61%
1 ene 2014 año
2.035 billones
+57.088 bn
2.89%
1 ene 2015 año
2.037 billones
+2.682 bn
0.13%
1 ene 2016 año
1.971 billones
-66.742 bn
-3.28%
Ranking de los países por los datos estadísticos actuales


Comentarios: