29
/es/
es
AIzaSyAYiBZKx7MnpbEhh9jyipgxe19OcubqV5w
April 1, 2024
39040
IDA only
IDX
false
2
1
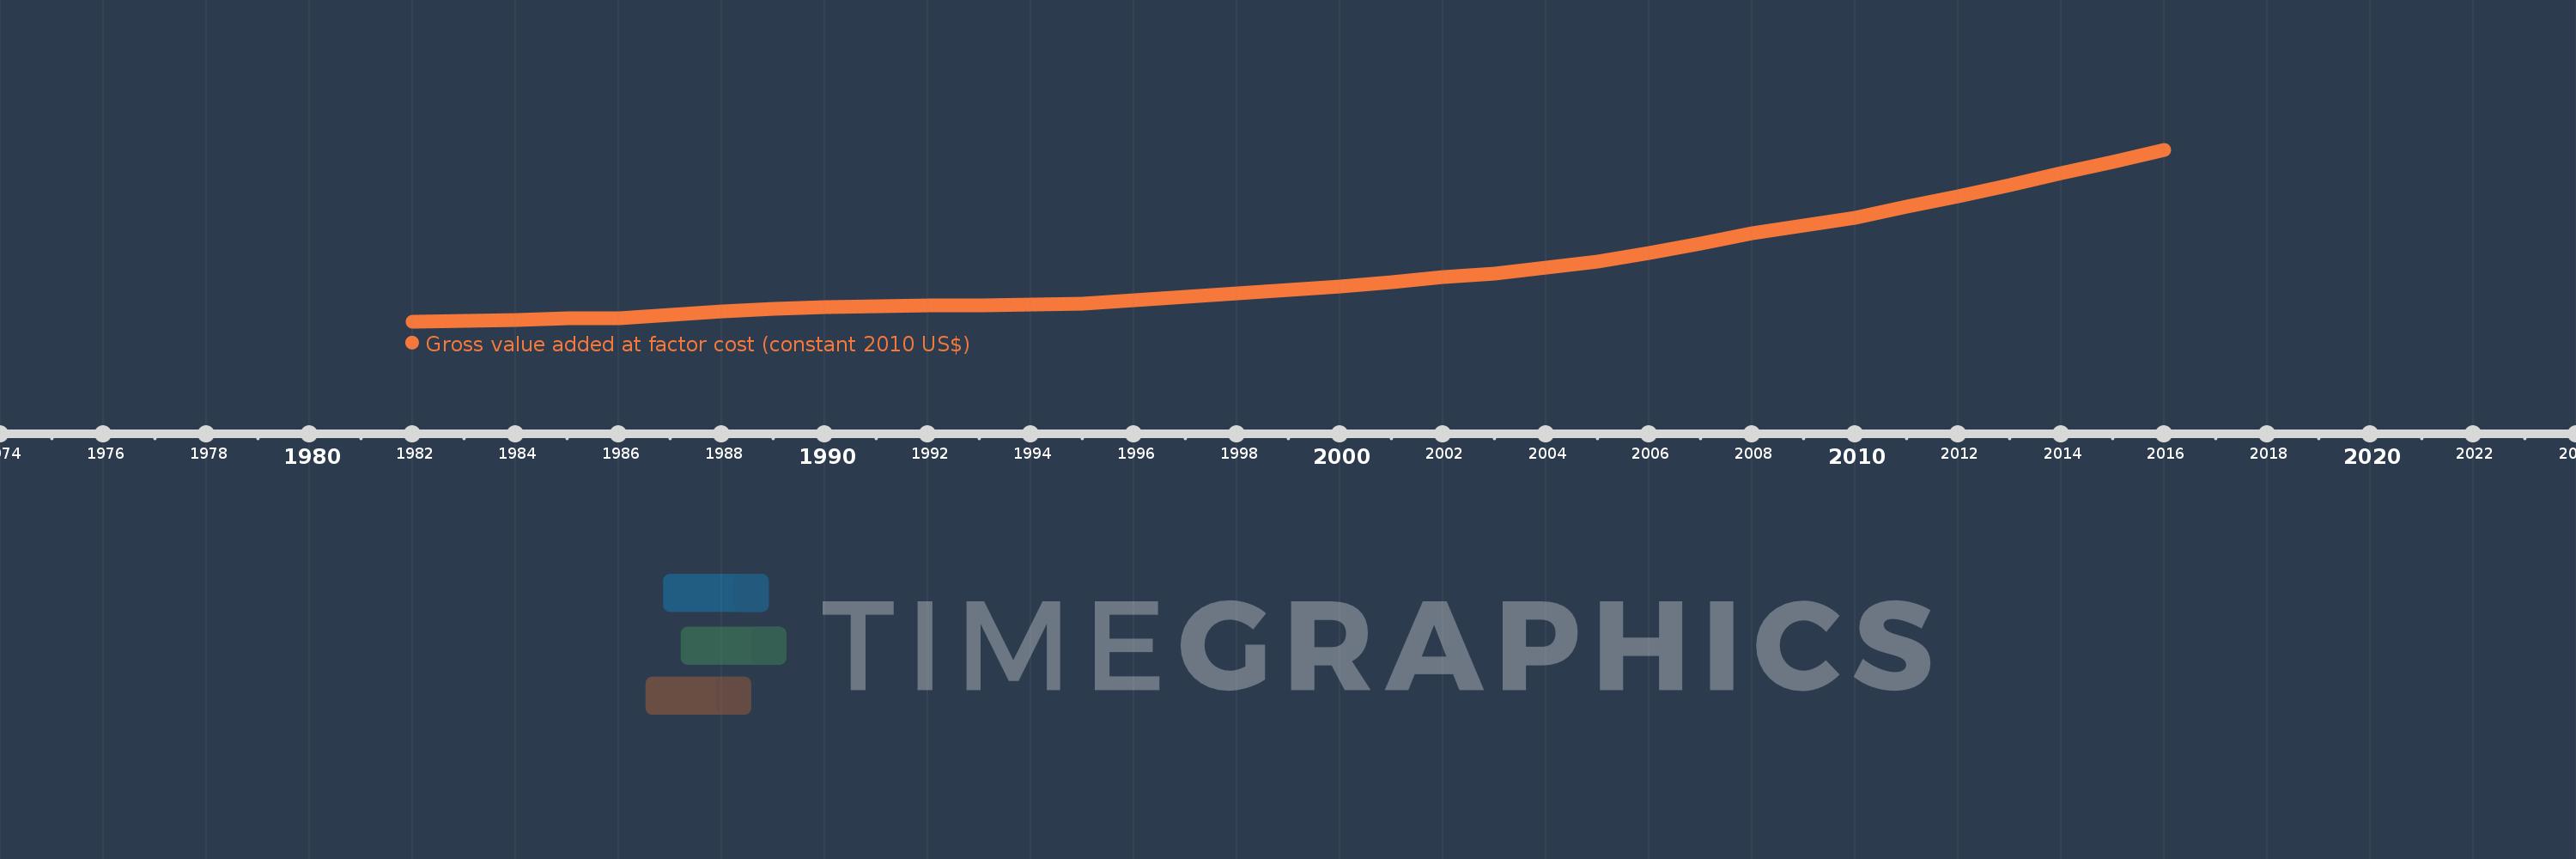
Gross value added at factor cost (constant 2010 US$)
2016,2015,2014,2013,2012,2011,2010,2009,2008,2007,2006,2005,2004,2003,2002,2001,2000,1999,1998,1997,1996,1995,1994,1993,1992,1991,1990,1989,1988,1987,1986,1985,1984,1983,1982
Estas estadísticas en otros países:
AfghanistanAlbaniaAlgeriaAndorraAntigua and BarbudaArgentinaArmeniaArubaAustraliaAustriaAzerbaijanBahamas, TheBangladeshBarbadosBelarusBelgiumBelizeBeninBermudaBhutanBoliviaBosnia and HerzegovinaBotswanaBrazilBulgariaBurkina FasoBurundiCabo VerdeCambodiaCameroonCanadaCaribbean small statesCentral African RepublicCentral Europe and the BalticsChadChileColombiaCongo, Dem. Rep.Costa RicaCroatiaCubaCyprusCzech RepublicDenmarkDominicaDominican RepublicEarly-demographic dividendEcuadorEgypt, Arab Rep.El SalvadorEquatorial GuineaEstoniaEthiopiaEuro areaEurope & Central AsiaEurope & Central Asia (excluding high income)Europe & Central Asia (IDA & IBRD countries)European UnionFaroe IslandsFijiFinlandFranceGabonGambia, TheGeorgiaGermanyGhanaGreeceGrenadaGuatemalaGuineaGuinea-BissauGuyanaHeavily indebted poor countries (HIPC)High incomeHondurasHong Kong SAR, ChinaHungaryIcelandIDA blendIDA onlyIDA totalIndiaIndonesiaIran, Islamic Rep.IrelandItalyJamaicaJapanJordanKazakhstanKenyaKiribatiKorea, Rep.KosovoKuwaitKyrgyz RepublicLao PDRLatin America & Caribbean Latin America & Caribbean (excluding high income)Latin America & the Caribbean (IDA & IBRD countries)LatviaLeast developed countries: UN classificationLebanonLesothoLiechtensteinLithuaniaLow incomeLower middle incomeLuxembourgMacao SAR, ChinaMacedonia, FYRMadagascarMalawiMaldivesMaliMaltaMarshall IslandsMauritaniaMauritiusMexicoMicronesia, Fed. Sts.Middle East & North Africa (excluding high income)Middle East & North Africa (IDA & IBRD countries)MoldovaMongoliaMontenegroMoroccoMozambiqueNamibiaNepalNetherlandsNew ZealandNicaraguaNigeriaNorth AmericaNorwayOECD membersPacific island small statesPakistanPalauPanamaParaguayPeruPolandPortugalPost-demographic dividendPre-demographic dividendRomaniaRussian FederationRwandaSao Tome and PrincipeSenegalSerbiaSeychellesSierra LeoneSingaporeSlovak RepublicSloveniaSouth AfricaSouth AsiaSouth Asia (IDA & IBRD)SpainSri LankaSt. Kitts and NevisSt. LuciaSt. Vincent and the GrenadinesSub-Saharan Africa Sub-Saharan Africa (excluding high income)Sub-Saharan Africa (IDA & IBRD countries)SudanSurinameSwazilandSwedenSwitzerlandTajikistanTanzaniaThailandTimor-LesteTongaTrinidad and TobagoTunisiaTurkeyTurkmenistanTuvaluUgandaUkraineUnited KingdomUnited StatesUruguayUzbekistanVanuatuVenezuela, RBVietnamWest Bank and GazaWorldZambiaZimbabwe línea de tiempo (timeline):
En esta escala de tiempo se presenta un gráfico de 1982 y 2016 de IDA only. Los datos de 1981 están ausentes. El número de observaciones reales por fecha: 35.
Fuente (nombre):
Indicadores del desarrollo mundial
Fuente (organización):
World Bank national accounts data, and OECD National Accounts data files.
Categorías:
Economy & Growth
Se ha actualizado:
23 abr 2017 año
Los indicadores de los cambios de valor en los últimos años
Mínimo:
252.0 bn
1 ene 1982 año
Máximo:
959.123 bn
1 ene 2016 año
A la fecha de observación
Valor
Cambio absoluto
El cambio con respecto al valor anterior
1 ene 1982 año
252.0 bn
+252.0 bn
0.0%
1 ene 1983 año
257.281 bn
+5.281 bn
2.1%
1 ene 1984 año
261.319 bn
+4.038 bn
1.57%
1 ene 1985 año
266.255 bn
+4.936 bn
1.89%
1 ene 1986 año
268.663 bn
+2.408 bn
0.9%
1 ene 1987 año
280.333 bn
+11.67 bn
4.34%
1 ene 1988 año
296.17 bn
+15.837 bn
5.65%
1 ene 1989 año
304.794 bn
+8.624 bn
2.91%
1 ene 1990 año
314.171 bn
+9.377 bn
3.08%
1 ene 1991 año
317.557 bn
+3.386 bn
1.08%
1 ene 1992 año
321.509 bn
+3.952 bn
1.24%
1 ene 1993 año
319.692 bn
-1.818 bn
-0.57%
1 ene 1994 año
324.855 bn
+5.163 bn
1.61%
1 ene 1995 año
327.17 bn
+2.315 bn
0.71%
1 ene 1996 año
341.354 bn
+14.184 bn
4.34%
1 ene 1997 año
356.122 bn
+14.768 bn
4.33%
1 ene 1998 año
370.074 bn
+13.952 bn
3.92%
1 ene 1999 año
383.674 bn
+13.599 bn
3.67%
1 ene 2000 año
398.962 bn
+15.289 bn
3.98%
1 ene 2001 año
414.779 bn
+15.816 bn
3.96%
1 ene 2002 año
435.336 bn
+20.557 bn
4.96%
1 ene 2003 año
451.483 bn
+16.147 bn
3.71%
1 ene 2004 año
476.195 bn
+24.712 bn
5.47%
1 ene 2005 año
501.779 bn
+25.584 bn
5.37%
1 ene 2006 año
535.191 bn
+33.412 bn
6.66%
1 ene 2007 año
573.707 bn
+38.515 bn
7.2%
1 ene 2008 año
615.699 bn
+41.992 bn
7.32%
1 ene 2009 año
650.669 bn
+34.97 bn
5.68%
1 ene 2010 año
680.984 bn
+30.315 bn
4.66%
1 ene 2011 año
725.271 bn
+44.287 bn
6.5%
1 ene 2012 año
769.43 bn
+44.16 bn
6.09%
1 ene 2013 año
816.477 bn
+47.046 bn
6.11%
1 ene 2014 año
862.985 bn
+46.508 bn
5.7%
1 ene 2015 año
910.552 bn
+47.567 bn
5.51%
1 ene 2016 año
959.123 bn
+48.571 bn
5.33%
Ranking de los países por los datos estadísticos actuales


Comentarios: