29
/es/
es
AIzaSyAYiBZKx7MnpbEhh9jyipgxe19OcubqV5w
April 1, 2024
275764
United Kingdom
GBR
true
2
1
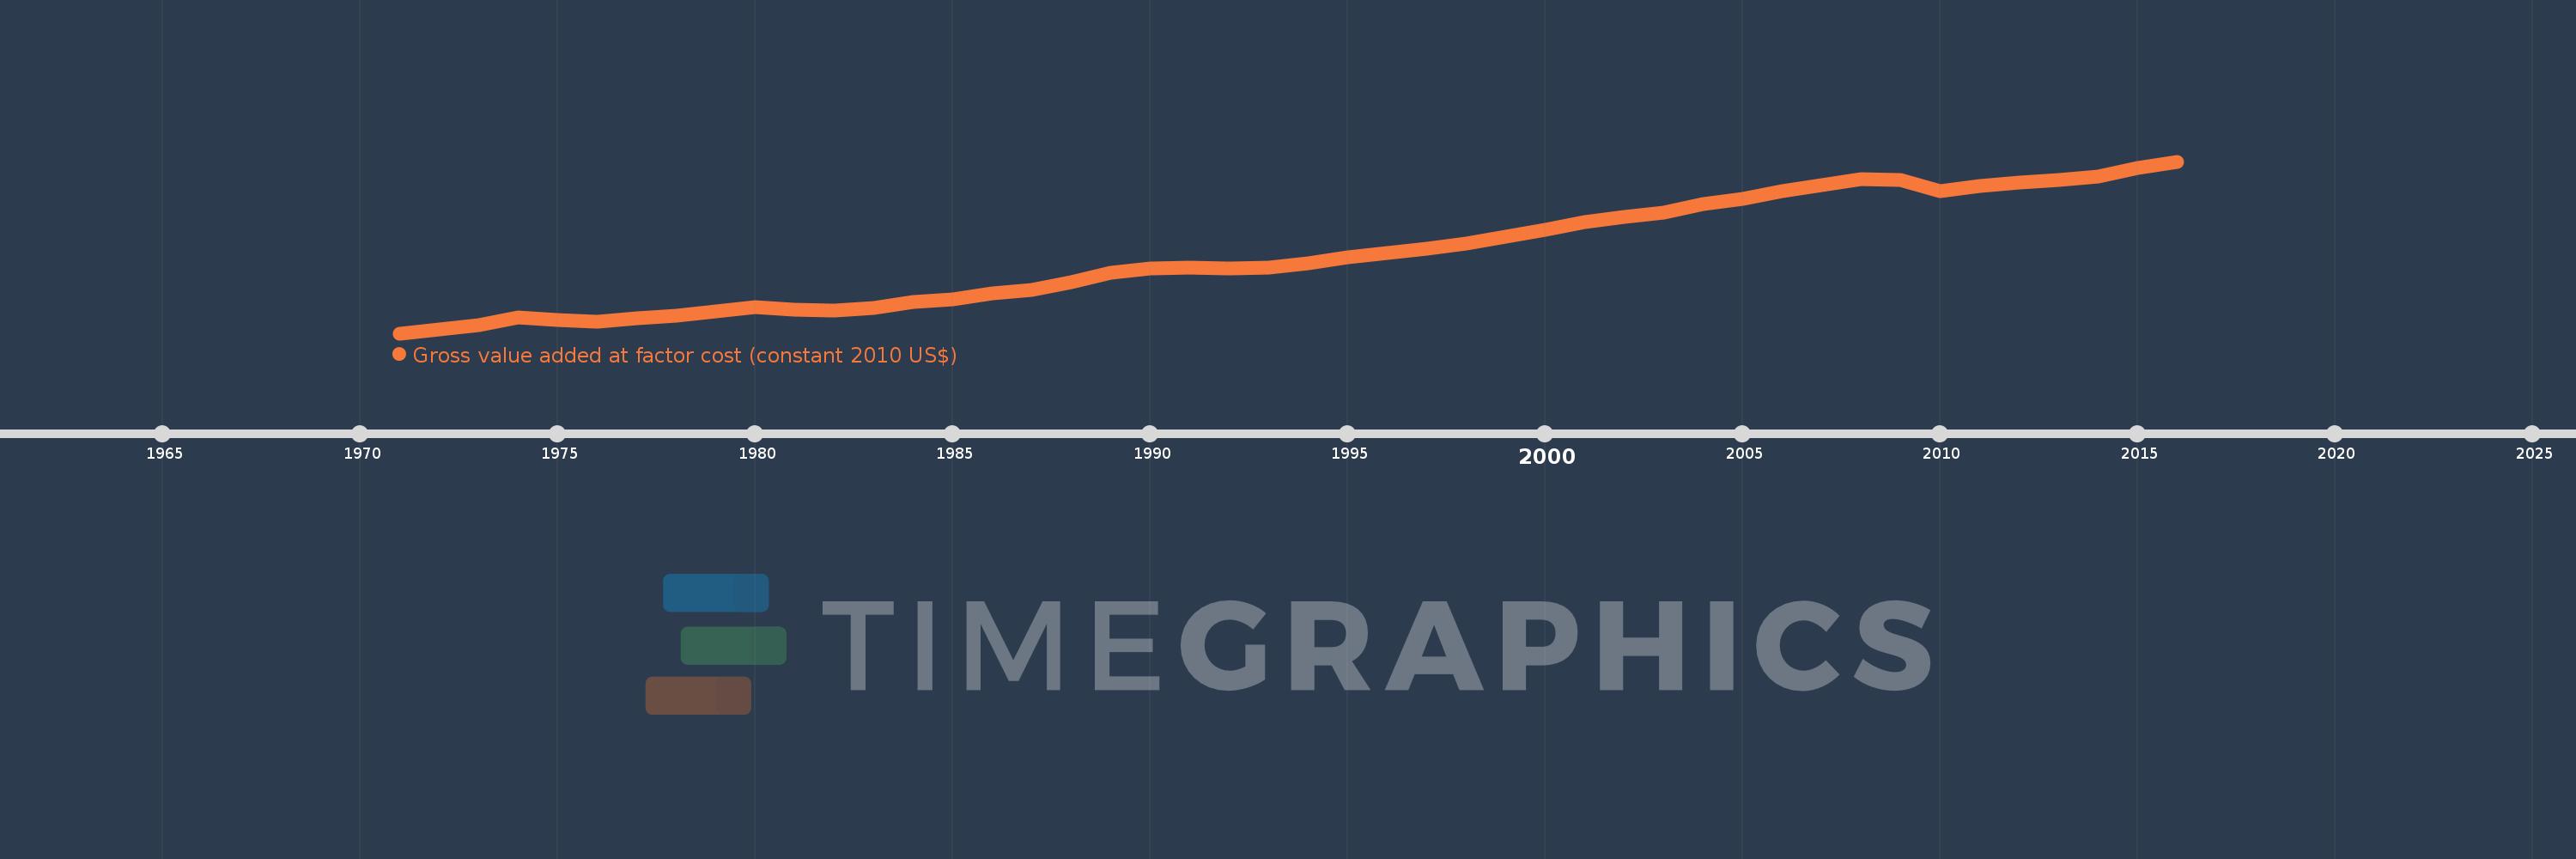
Gross value added at factor cost (constant 2010 US$)
2016,2015,2014,2013,2012,2011,2010,2009,2008,2007,2006,2005,2004,2003,2002,2001,2000,1999,1998,1997,1996,1995,1994,1993,1992,1991,1990,1989,1988,1987,1986,1985,1984,1983,1982,1981,1980,1979,1978,1977,1976,1975,1974,1973,1972,1971
Estas estadísticas en otros países:
AfghanistanAlbaniaAlgeriaAndorraAntigua and BarbudaArgentinaArmeniaArubaAustraliaAustriaAzerbaijanBahamas, TheBangladeshBarbadosBelarusBelgiumBelizeBeninBermudaBhutanBoliviaBosnia and HerzegovinaBotswanaBrazilBulgariaBurkina FasoBurundiCabo VerdeCambodiaCameroonCanadaCaribbean small statesCentral African RepublicCentral Europe and the BalticsChadChileColombiaCongo, Dem. Rep.Costa RicaCroatiaCubaCyprusCzech RepublicDenmarkDominicaDominican RepublicEarly-demographic dividendEcuadorEgypt, Arab Rep.El SalvadorEquatorial GuineaEstoniaEthiopiaEuro areaEurope & Central AsiaEurope & Central Asia (excluding high income)Europe & Central Asia (IDA & IBRD countries)European UnionFaroe IslandsFijiFinlandFranceGabonGambia, TheGeorgiaGermanyGhanaGreeceGrenadaGuatemalaGuineaGuinea-BissauGuyanaHeavily indebted poor countries (HIPC)High incomeHondurasHong Kong SAR, ChinaHungaryIcelandIDA blendIDA onlyIDA totalIndiaIndonesiaIran, Islamic Rep.IrelandItalyJamaicaJapanJordanKazakhstanKenyaKiribatiKorea, Rep.KosovoKuwaitKyrgyz RepublicLao PDRLatin America & Caribbean Latin America & Caribbean (excluding high income)Latin America & the Caribbean (IDA & IBRD countries)LatviaLeast developed countries: UN classificationLebanonLesothoLiechtensteinLithuaniaLow incomeLower middle incomeLuxembourgMacao SAR, ChinaMacedonia, FYRMadagascarMalawiMaldivesMaliMaltaMarshall IslandsMauritaniaMauritiusMexicoMicronesia, Fed. Sts.Middle East & North Africa (excluding high income)Middle East & North Africa (IDA & IBRD countries)MoldovaMongoliaMontenegroMoroccoMozambiqueNamibiaNepalNetherlandsNew ZealandNicaraguaNigeriaNorth AmericaNorwayOECD membersPacific island small statesPakistanPalauPanamaParaguayPeruPolandPortugalPost-demographic dividendPre-demographic dividendRomaniaRussian FederationRwandaSao Tome and PrincipeSenegalSerbiaSeychellesSierra LeoneSingaporeSlovak RepublicSloveniaSouth AfricaSouth AsiaSouth Asia (IDA & IBRD)SpainSri LankaSt. Kitts and NevisSt. LuciaSt. Vincent and the GrenadinesSub-Saharan Africa Sub-Saharan Africa (excluding high income)Sub-Saharan Africa (IDA & IBRD countries)SudanSurinameSwazilandSwedenSwitzerlandTajikistanTanzaniaThailandTimor-LesteTongaTrinidad and TobagoTunisiaTurkeyTurkmenistanTuvaluUgandaUkraineUnited KingdomUnited StatesUruguayUzbekistanVanuatuVenezuela, RBVietnamWest Bank and GazaWorldZambiaZimbabwe línea de tiempo (timeline):
En esta escala de tiempo se presenta un gráfico de 1971 y 2016 de United Kingdom. Los datos de 1970 están ausentes. El número de observaciones reales por fecha: 46.
Fuente (nombre):
Indicadores del desarrollo mundial
Fuente (organización):
World Bank national accounts data, and OECD National Accounts data files.
Categorías:
Economy & Growth
Se ha actualizado:
23 abr 2017 año
Los indicadores de los cambios de valor en los últimos años
En promedio:
1.587 billones
Mínimo:
895.933 bn
1 ene 1971 año
Máximo:
2.403 billones
1 ene 2016 año
A la fecha de observación
Valor
Cambio absoluto
El cambio con respecto al valor anterior
1 ene 1971 año
895.933 bn
+895.933 bn
0.0%
1 ene 1972 año
929.849 bn
+33.916 bn
3.79%
1 ene 1973 año
970.324 bn
+40.475 bn
4.35%
1 ene 1974 año
1.036 billones
+66.138 bn
6.82%
1 ene 1975 año
1.013 billones
-23.415 bn
-2.26%
1 ene 1976 año
998.419 bn
-14.628 bn
-1.44%
1 ene 1977 año
1.026 billones
+27.139 bn
2.72%
1 ene 1978 año
1.049 billones
+23.67 bn
2.31%
1 ene 1979 año
1.088 billones
+39.093 bn
3.73%
1 ene 1980 año
1.124 billones
+36.143 bn
3.32%
1 ene 1981 año
1.102 billones
-22.554 bn
-2.01%
1 ene 1982 año
1.096 billones
-5.688 bn
-0.52%
1 ene 1983 año
1.121 billones
+25.246 bn
2.3%
1 ene 1984 año
1.168 billones
+46.983 bn
4.19%
1 ene 1985 año
1.191 billones
+22.851 bn
1.96%
1 ene 1986 año
1.244 billones
+52.479 bn
4.41%
1 ene 1987 año
1.28 billones
+35.734 bn
2.87%
1 ene 1988 año
1.347 billones
+67.551 bn
5.28%
1 ene 1989 año
1.424 billones
+76.645 bn
5.69%
1 ene 1990 año
1.462 billones
+37.903 bn
2.66%
1 ene 1991 año
1.476 billones
+13.972 bn
0.96%
1 ene 1992 año
1.465 billones
-10.636 bn
-0.72%
1 ene 1993 año
1.472 billones
+7.502 bn
0.51%
1 ene 1994 año
1.51 billones
+37.663 bn
2.56%
1 ene 1995 año
1.565 billones
+54.968 bn
3.64%
1 ene 1996 año
1.599 billones
+34.102 bn
2.18%
1 ene 1997 año
1.638 billones
+38.448 bn
2.4%
1 ene 1998 año
1.685 billones
+47.529 bn
2.9%
1 ene 1999 año
1.742 billones
+56.773 bn
3.37%
1 ene 2000 año
1.802 billones
+59.724 bn
3.43%
1 ene 2001 año
1.87 billones
+68.581 bn
3.81%
1 ene 2002 año
1.916 billones
+46.215 bn
2.47%
1 ene 2003 año
1.957 billones
+40.852 bn
2.13%
1 ene 2004 año
2.027 billones
+69.278 bn
3.54%
1 ene 2005 año
2.074 billones
+47.286 bn
2.33%
1 ene 2006 año
2.141 billones
+67.479 bn
3.25%
1 ene 2007 año
2.194 billones
+52.483 bn
2.45%
1 ene 2008 año
2.249 billones
+55.518 bn
2.53%
1 ene 2009 año
2.24 billones
-9.314 bn
-0.41%
1 ene 2010 año
2.14 billones
-100.19 bn
-4.47%
1 ene 2011 año
2.186 billones
+45.93 bn
2.15%
1 ene 2012 año
2.215 billones
+29.242 bn
1.34%
1 ene 2013 año
2.238 billones
+23.183 bn
1.05%
1 ene 2014 año
2.269 billones
+30.884 bn
1.38%
1 ene 2015 año
2.346 billones
+76.949 bn
3.39%
1 ene 2016 año
2.403 billones
+57.387 bn
2.45%
Ranking de los países por los datos estadísticos actuales


Comentarios: