29
/es/
es
AIzaSyAYiBZKx7MnpbEhh9jyipgxe19OcubqV5w
April 1, 2024
35019
Heavily indebted poor countries (HIPC)
HPC
false
2
1
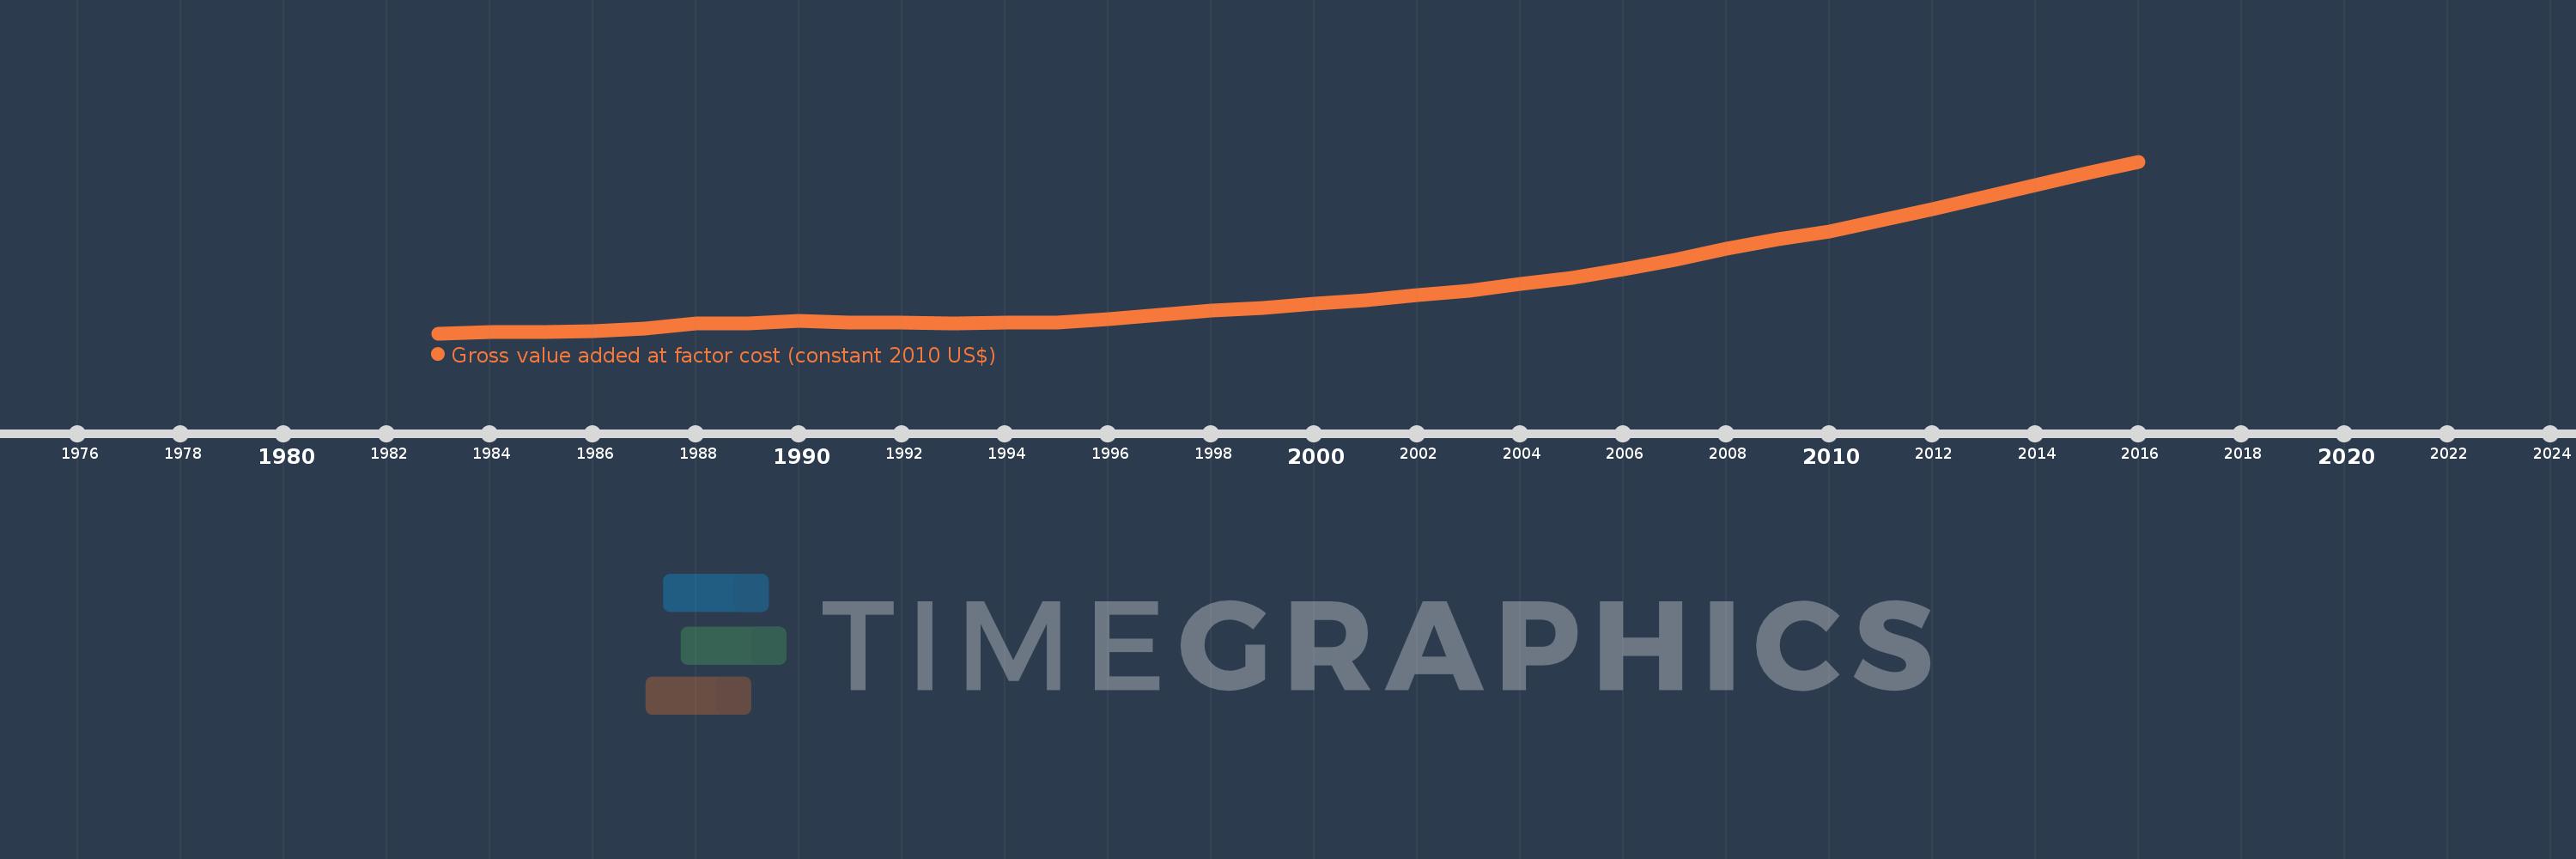
Gross value added at factor cost (constant 2010 US$)
2016,2015,2014,2013,2012,2011,2010,2009,2008,2007,2006,2005,2004,2003,2002,2001,2000,1999,1998,1997,1996,1995,1994,1993,1992,1991,1990,1989,1988,1987,1986,1985,1984,1983
Estas estadísticas en otros países:
AfghanistanAlbaniaAlgeriaAndorraAntigua and BarbudaArgentinaArmeniaArubaAustraliaAustriaAzerbaijanBahamas, TheBangladeshBarbadosBelarusBelgiumBelizeBeninBermudaBhutanBoliviaBosnia and HerzegovinaBotswanaBrazilBulgariaBurkina FasoBurundiCabo VerdeCambodiaCameroonCanadaCaribbean small statesCentral African RepublicCentral Europe and the BalticsChadChileColombiaCongo, Dem. Rep.Costa RicaCroatiaCubaCyprusCzech RepublicDenmarkDominicaDominican RepublicEarly-demographic dividendEcuadorEgypt, Arab Rep.El SalvadorEquatorial GuineaEstoniaEthiopiaEuro areaEurope & Central AsiaEurope & Central Asia (excluding high income)Europe & Central Asia (IDA & IBRD countries)European UnionFaroe IslandsFijiFinlandFranceGabonGambia, TheGeorgiaGermanyGhanaGreeceGrenadaGuatemalaGuineaGuinea-BissauGuyanaHeavily indebted poor countries (HIPC)High incomeHondurasHong Kong SAR, ChinaHungaryIcelandIDA blendIDA onlyIDA totalIndiaIndonesiaIran, Islamic Rep.IrelandItalyJamaicaJapanJordanKazakhstanKenyaKiribatiKorea, Rep.KosovoKuwaitKyrgyz RepublicLao PDRLatin America & Caribbean Latin America & Caribbean (excluding high income)Latin America & the Caribbean (IDA & IBRD countries)LatviaLeast developed countries: UN classificationLebanonLesothoLiechtensteinLithuaniaLow incomeLower middle incomeLuxembourgMacao SAR, ChinaMacedonia, FYRMadagascarMalawiMaldivesMaliMaltaMarshall IslandsMauritaniaMauritiusMexicoMicronesia, Fed. Sts.Middle East & North Africa (excluding high income)Middle East & North Africa (IDA & IBRD countries)MoldovaMongoliaMontenegroMoroccoMozambiqueNamibiaNepalNetherlandsNew ZealandNicaraguaNigeriaNorth AmericaNorwayOECD membersPacific island small statesPakistanPalauPanamaParaguayPeruPolandPortugalPost-demographic dividendPre-demographic dividendRomaniaRussian FederationRwandaSao Tome and PrincipeSenegalSerbiaSeychellesSierra LeoneSingaporeSlovak RepublicSloveniaSouth AfricaSouth AsiaSouth Asia (IDA & IBRD)SpainSri LankaSt. Kitts and NevisSt. LuciaSt. Vincent and the GrenadinesSub-Saharan Africa Sub-Saharan Africa (excluding high income)Sub-Saharan Africa (IDA & IBRD countries)SudanSurinameSwazilandSwedenSwitzerlandTajikistanTanzaniaThailandTimor-LesteTongaTrinidad and TobagoTunisiaTurkeyTurkmenistanTuvaluUgandaUkraineUnited KingdomUnited StatesUruguayUzbekistanVanuatuVenezuela, RBVietnamWest Bank and GazaWorldZambiaZimbabwe línea de tiempo (timeline):
En esta escala de tiempo se presenta un gráfico de 1983 y 2016 de Heavily indebted poor countries (HIPC). Los datos de 1982 están ausentes. El número de observaciones reales por fecha: 34.
Fuente (nombre):
Indicadores del desarrollo mundial
Fuente (organización):
World Bank national accounts data, and OECD National Accounts data files.
Categorías:
Economy & Growth
Se ha actualizado:
23 abr 2017 año
Los indicadores de los cambios de valor en los últimos años
Mínimo:
171.064 bn
1 ene 1983 año
Máximo:
559.04 bn
1 ene 2016 año
A la fecha de observación
Valor
Cambio absoluto
El cambio con respecto al valor anterior
1 ene 1983 año
171.064 bn
+171.064 bn
0.0%
1 ene 1984 año
173.362 bn
+2.298 bn
1.34%
1 ene 1985 año
174.905 bn
+1.543 bn
0.89%
1 ene 1986 año
175.503 bn
+597.784 millones
0.34%
1 ene 1987 año
182.31 bn
+6.807 bn
3.88%
1 ene 1988 año
192.423 bn
+10.113 bn
5.55%
1 ene 1989 año
193.575 bn
+1.153 bn
0.6%
1 ene 1990 año
198.369 bn
+4.793 bn
2.48%
1 ene 1991 año
194.823 bn
-3.546 bn
-1.79%
1 ene 1992 año
195.796 bn
+972.593 millones
0.5%
1 ene 1993 año
192.94 bn
-2.855 bn
-1.46%
1 ene 1994 año
195.261 bn
+2.321 bn
1.2%
1 ene 1995 año
195.064 bn
-197.041 millones
-0.1%
1 ene 1996 año
203.782 bn
+8.718 bn
4.47%
1 ene 1997 año
213.014 bn
+9.232 bn
4.53%
1 ene 1998 año
221.977 bn
+8.964 bn
4.21%
1 ene 1999 año
229.211 bn
+7.233 bn
3.26%
1 ene 2000 año
237.727 bn
+8.516 bn
3.72%
1 ene 2001 año
245.847 bn
+8.121 bn
3.42%
1 ene 2002 año
257.075 bn
+11.228 bn
4.57%
1 ene 2003 año
267.31 bn
+10.235 bn
3.98%
1 ene 2004 año
281.856 bn
+14.545 bn
5.44%
1 ene 2005 año
296.187 bn
+14.332 bn
5.08%
1 ene 2006 año
315.798 bn
+19.611 bn
6.62%
1 ene 2007 año
337.811 bn
+22.012 bn
6.97%
1 ene 2008 año
362.261 bn
+24.45 bn
7.24%
1 ene 2009 año
383.491 bn
+21.231 bn
5.86%
1 ene 2010 año
401.165 bn
+17.673 bn
4.61%
1 ene 2011 año
426.611 bn
+25.447 bn
6.34%
1 ene 2012 año
451.567 bn
+24.956 bn
5.85%
1 ene 2013 año
479.057 bn
+27.491 bn
6.09%
1 ene 2014 año
505.707 bn
+26.65 bn
5.56%
1 ene 2015 año
532.344 bn
+26.637 bn
5.27%
1 ene 2016 año
559.04 bn
+26.696 bn
5.01%
Ranking de los países por los datos estadísticos actuales


Comentarios: