29
/es/
es
AIzaSyAYiBZKx7MnpbEhh9jyipgxe19OcubqV5w
April 1, 2024
130537
Ethiopia
ETH
true
2
1
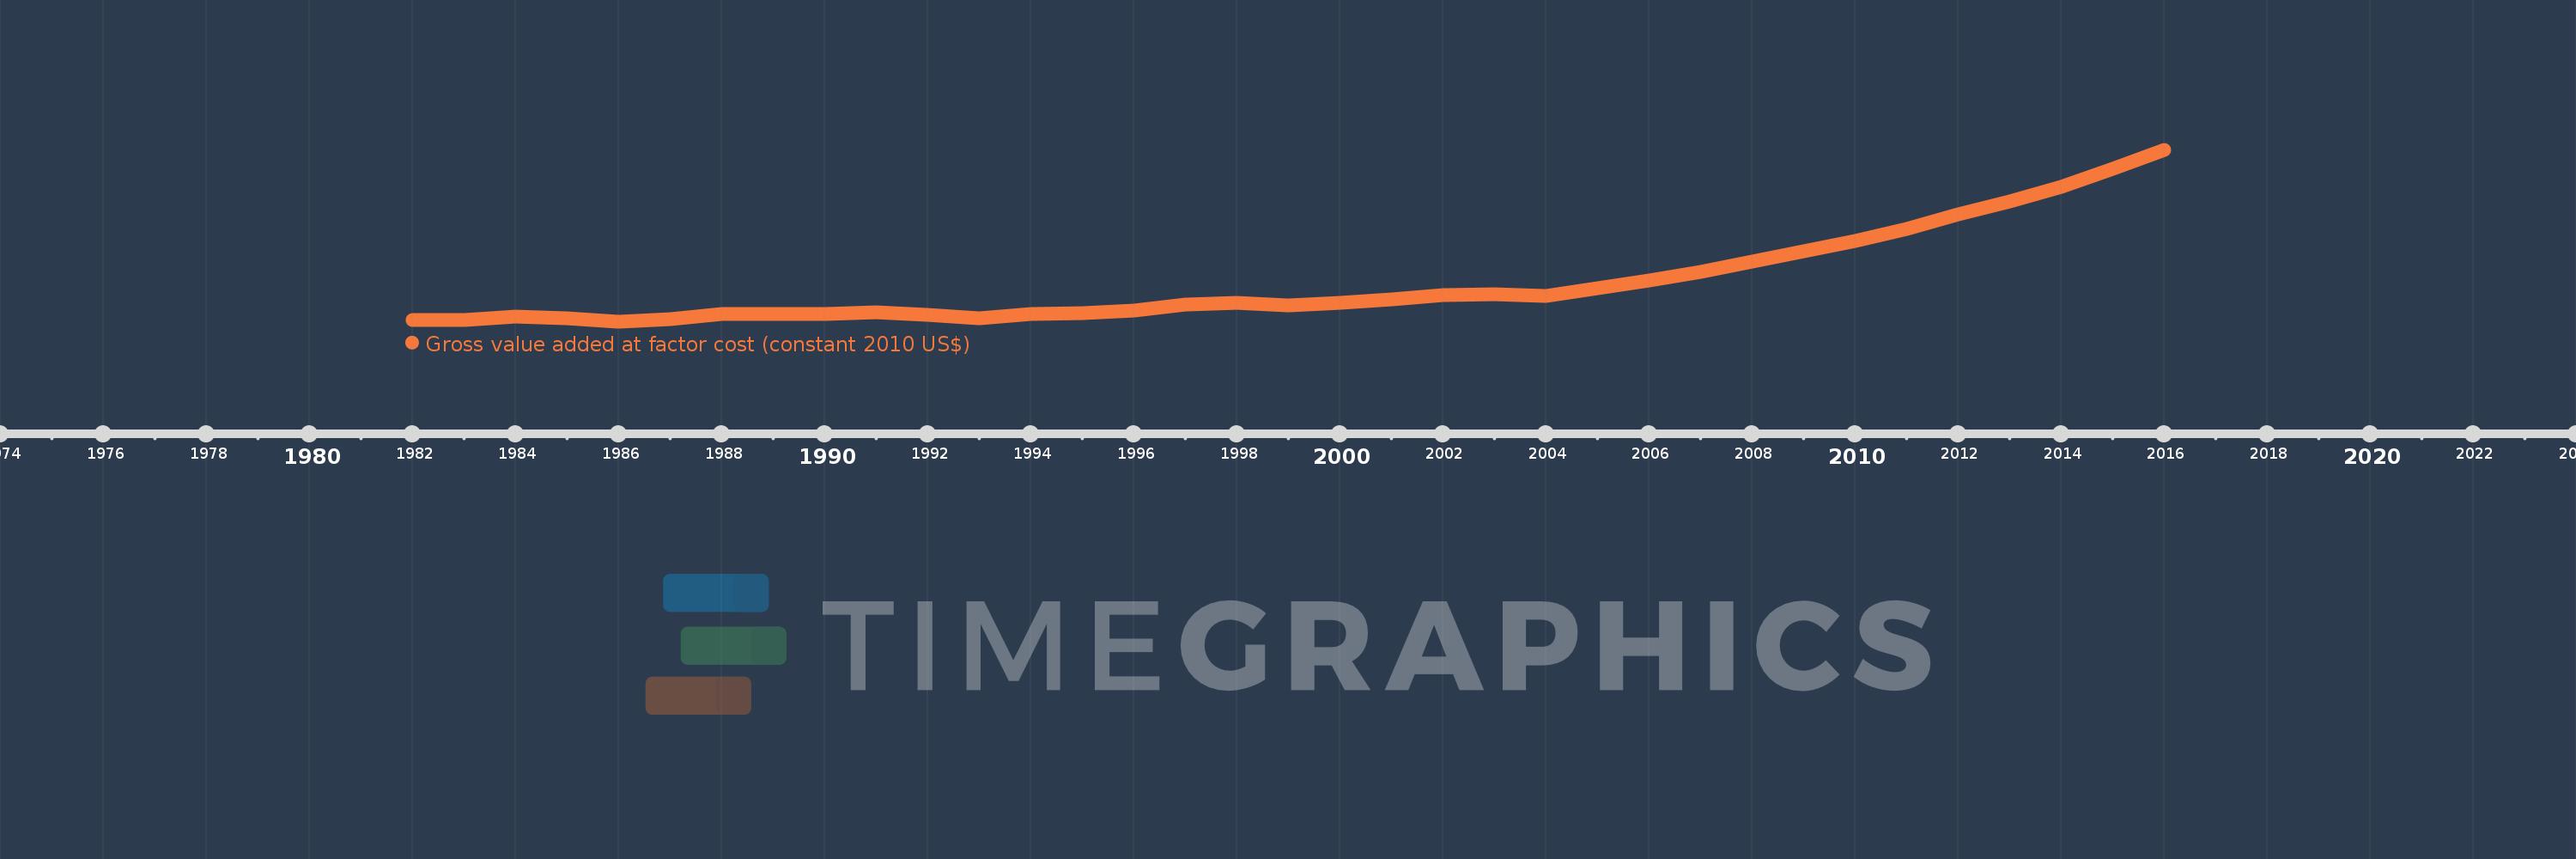
Gross value added at factor cost (constant 2010 US$)
2016,2015,2014,2013,2012,2011,2010,2009,2008,2007,2006,2005,2004,2003,2002,2001,2000,1999,1998,1997,1996,1995,1994,1993,1992,1991,1990,1989,1988,1987,1986,1985,1984,1983,1982
Estas estadísticas en otros países:
AfghanistanAlbaniaAlgeriaAndorraAntigua and BarbudaArgentinaArmeniaArubaAustraliaAustriaAzerbaijanBahamas, TheBangladeshBarbadosBelarusBelgiumBelizeBeninBermudaBhutanBoliviaBosnia and HerzegovinaBotswanaBrazilBulgariaBurkina FasoBurundiCabo VerdeCambodiaCameroonCanadaCaribbean small statesCentral African RepublicCentral Europe and the BalticsChadChileColombiaCongo, Dem. Rep.Costa RicaCroatiaCubaCyprusCzech RepublicDenmarkDominicaDominican RepublicEarly-demographic dividendEcuadorEgypt, Arab Rep.El SalvadorEquatorial GuineaEstoniaEthiopiaEuro areaEurope & Central AsiaEurope & Central Asia (excluding high income)Europe & Central Asia (IDA & IBRD countries)European UnionFaroe IslandsFijiFinlandFranceGabonGambia, TheGeorgiaGermanyGhanaGreeceGrenadaGuatemalaGuineaGuinea-BissauGuyanaHeavily indebted poor countries (HIPC)High incomeHondurasHong Kong SAR, ChinaHungaryIcelandIDA blendIDA onlyIDA totalIndiaIndonesiaIran, Islamic Rep.IrelandItalyJamaicaJapanJordanKazakhstanKenyaKiribatiKorea, Rep.KosovoKuwaitKyrgyz RepublicLao PDRLatin America & Caribbean Latin America & Caribbean (excluding high income)Latin America & the Caribbean (IDA & IBRD countries)LatviaLeast developed countries: UN classificationLebanonLesothoLiechtensteinLithuaniaLow incomeLower middle incomeLuxembourgMacao SAR, ChinaMacedonia, FYRMadagascarMalawiMaldivesMaliMaltaMarshall IslandsMauritaniaMauritiusMexicoMicronesia, Fed. Sts.Middle East & North Africa (excluding high income)Middle East & North Africa (IDA & IBRD countries)MoldovaMongoliaMontenegroMoroccoMozambiqueNamibiaNepalNetherlandsNew ZealandNicaraguaNigeriaNorth AmericaNorwayOECD membersPacific island small statesPakistanPalauPanamaParaguayPeruPolandPortugalPost-demographic dividendPre-demographic dividendRomaniaRussian FederationRwandaSao Tome and PrincipeSenegalSerbiaSeychellesSierra LeoneSingaporeSlovak RepublicSloveniaSouth AfricaSouth AsiaSouth Asia (IDA & IBRD)SpainSri LankaSt. Kitts and NevisSt. LuciaSt. Vincent and the GrenadinesSub-Saharan Africa Sub-Saharan Africa (excluding high income)Sub-Saharan Africa (IDA & IBRD countries)SudanSurinameSwazilandSwedenSwitzerlandTajikistanTanzaniaThailandTimor-LesteTongaTrinidad and TobagoTunisiaTurkeyTurkmenistanTuvaluUgandaUkraineUnited KingdomUnited StatesUruguayUzbekistanVanuatuVenezuela, RBVietnamWest Bank and GazaWorldZambiaZimbabwe línea de tiempo (timeline):
En esta escala de tiempo se presenta un gráfico de 1982 y 2016 de Ethiopia. Los datos de 1981 están ausentes. El número de observaciones reales por fecha: 35.
Fuente (nombre):
Indicadores del desarrollo mundial
Fuente (organización):
World Bank national accounts data, and OECD National Accounts data files.
Categorías:
Economy & Growth
Se ha actualizado:
23 abr 2017 año
Los indicadores de los cambios de valor en los últimos años
Mínimo:
7.286 bn
1 ene 1986 año
Máximo:
44.873 bn
1 ene 2016 año
A la fecha de observación
Valor
Cambio absoluto
El cambio con respecto al valor anterior
1 ene 1982 año
7.702 bn
+7.702 bn
0.0%
1 ene 1983 año
7.753 bn
+51.35 millones
0.67%
1 ene 1984 año
8.559 bn
+805.955 millones
10.4%
1 ene 1985 año
8.063 bn
-495.514 millones
-5.79%
1 ene 1986 año
7.286 bn
-776.908 millones
-9.64%
1 ene 1987 año
7.978 bn
+691.462 millones
9.49%
1 ene 1988 año
9.079 bn
+1.101 bn
13.8%
1 ene 1989 año
9.089 bn
+10.202 millones
0.11%
1 ene 1990 año
9.105 bn
+15.756 millones
0.17%
1 ene 1991 año
9.416 bn
+310.842 millones
3.41%
1 ene 1992 año
8.785 bn
-630.554 millones
-6.7%
1 ene 1993 año
8.135 bn
-649.843 millones
-7.4%
1 ene 1994 año
9.109 bn
+973.385 millones
11.96%
1 ene 1995 año
9.253 bn
+144.466 millones
1.59%
1 ene 1996 año
9.823 bn
+570.286 millones
6.16%
1 ene 1997 año
11.075 bn
+1.251 bn
12.74%
1 ene 1998 año
11.389 bn
+314.547 millones
2.84%
1 ene 1999 año
10.979 bn
-410.483 millones
-3.6%
1 ene 2000 año
11.541 bn
+562.697 millones
5.13%
1 ene 2001 año
12.22 bn
+678.933 millones
5.88%
1 ene 2002 año
13.127 bn
+906.477 millones
7.42%
1 ene 2003 año
13.341 bn
+214.481 millones
1.63%
1 ene 2004 año
13.061 bn
-280.007 millones
-2.1%
1 ene 2005 año
14.593 bn
+1.532 bn
11.73%
1 ene 2006 año
16.438 bn
+1.845 bn
12.64%
1 ene 2007 año
18.335 bn
+1.897 bn
11.54%
1 ene 2008 año
20.498 bn
+2.163 bn
11.8%
1 ene 2009 año
22.791 bn
+2.293 bn
11.19%
1 ene 2010 año
25.08 bn
+2.289 bn
10.04%
1 ene 2011 año
27.73 bn
+2.65 bn
10.57%
1 ene 2012 año
30.887 bn
+3.157 bn
11.39%
1 ene 2013 año
33.574 bn
+2.687 bn
8.7%
1 ene 2014 año
36.912 bn
+3.338 bn
9.94%
1 ene 2015 año
40.72 bn
+3.807 bn
10.31%
1 ene 2016 año
44.873 bn
+4.153 bn
10.2%
Ranking de los países por los datos estadísticos actuales


Comentarios: