29
/es/
es
AIzaSyAYiBZKx7MnpbEhh9jyipgxe19OcubqV5w
April 1, 2024
38209
IDA blend
IDB
false
2
1
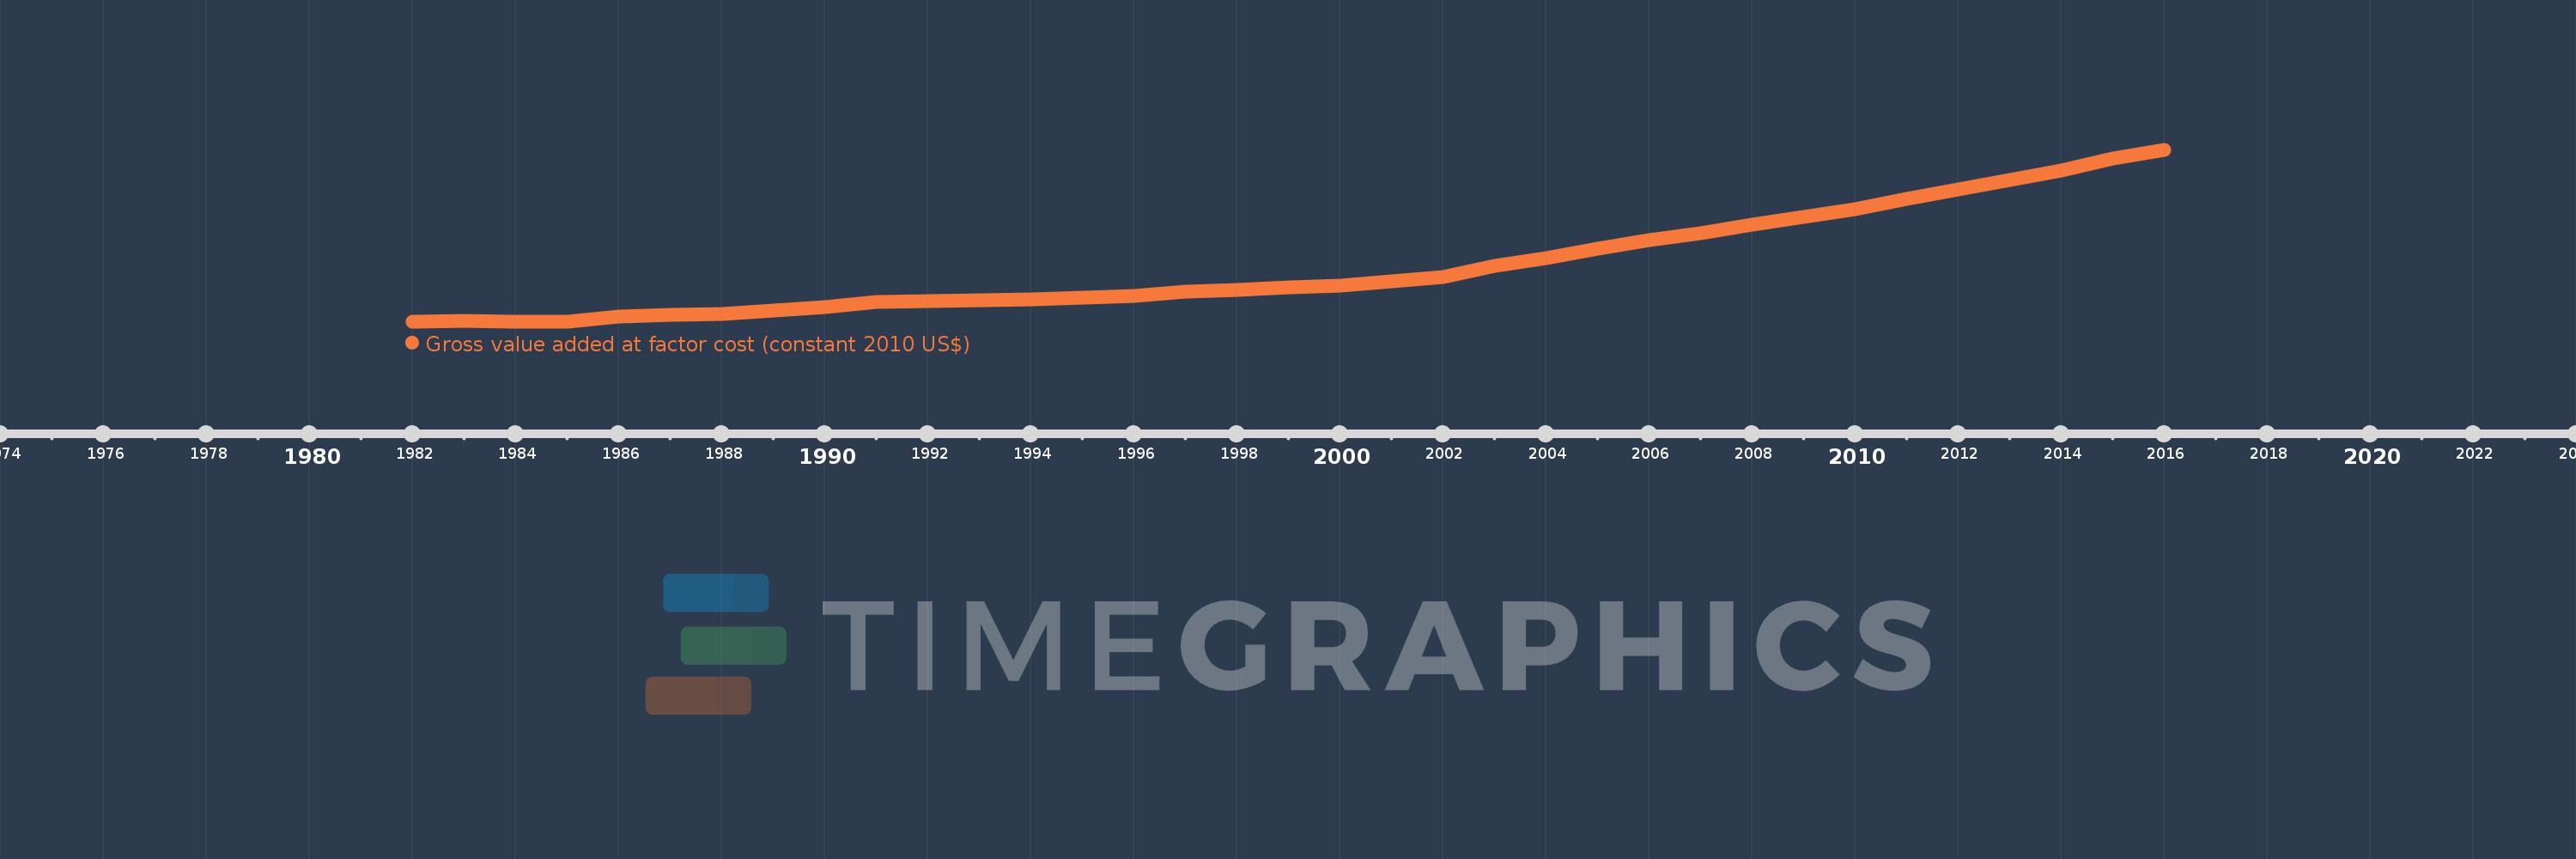
Gross value added at factor cost (constant 2010 US$)
2016,2015,2014,2013,2012,2011,2010,2009,2008,2007,2006,2005,2004,2003,2002,2001,2000,1999,1998,1997,1996,1995,1994,1993,1992,1991,1990,1989,1988,1987,1986,1985,1984,1983,1982
Estas estadísticas en otros países:
AfghanistanAlbaniaAlgeriaAndorraAntigua and BarbudaArgentinaArmeniaArubaAustraliaAustriaAzerbaijanBahamas, TheBangladeshBarbadosBelarusBelgiumBelizeBeninBermudaBhutanBoliviaBosnia and HerzegovinaBotswanaBrazilBulgariaBurkina FasoBurundiCabo VerdeCambodiaCameroonCanadaCaribbean small statesCentral African RepublicCentral Europe and the BalticsChadChileColombiaCongo, Dem. Rep.Costa RicaCroatiaCubaCyprusCzech RepublicDenmarkDominicaDominican RepublicEarly-demographic dividendEcuadorEgypt, Arab Rep.El SalvadorEquatorial GuineaEstoniaEthiopiaEuro areaEurope & Central AsiaEurope & Central Asia (excluding high income)Europe & Central Asia (IDA & IBRD countries)European UnionFaroe IslandsFijiFinlandFranceGabonGambia, TheGeorgiaGermanyGhanaGreeceGrenadaGuatemalaGuineaGuinea-BissauGuyanaHeavily indebted poor countries (HIPC)High incomeHondurasHong Kong SAR, ChinaHungaryIcelandIDA blendIDA onlyIDA totalIndiaIndonesiaIran, Islamic Rep.IrelandItalyJamaicaJapanJordanKazakhstanKenyaKiribatiKorea, Rep.KosovoKuwaitKyrgyz RepublicLao PDRLatin America & Caribbean Latin America & Caribbean (excluding high income)Latin America & the Caribbean (IDA & IBRD countries)LatviaLeast developed countries: UN classificationLebanonLesothoLiechtensteinLithuaniaLow incomeLower middle incomeLuxembourgMacao SAR, ChinaMacedonia, FYRMadagascarMalawiMaldivesMaliMaltaMarshall IslandsMauritaniaMauritiusMexicoMicronesia, Fed. Sts.Middle East & North Africa (excluding high income)Middle East & North Africa (IDA & IBRD countries)MoldovaMongoliaMontenegroMoroccoMozambiqueNamibiaNepalNetherlandsNew ZealandNicaraguaNigeriaNorth AmericaNorwayOECD membersPacific island small statesPakistanPalauPanamaParaguayPeruPolandPortugalPost-demographic dividendPre-demographic dividendRomaniaRussian FederationRwandaSao Tome and PrincipeSenegalSerbiaSeychellesSierra LeoneSingaporeSlovak RepublicSloveniaSouth AfricaSouth AsiaSouth Asia (IDA & IBRD)SpainSri LankaSt. Kitts and NevisSt. LuciaSt. Vincent and the GrenadinesSub-Saharan Africa Sub-Saharan Africa (excluding high income)Sub-Saharan Africa (IDA & IBRD countries)SudanSurinameSwazilandSwedenSwitzerlandTajikistanTanzaniaThailandTimor-LesteTongaTrinidad and TobagoTunisiaTurkeyTurkmenistanTuvaluUgandaUkraineUnited KingdomUnited StatesUruguayUzbekistanVanuatuVenezuela, RBVietnamWest Bank and GazaWorldZambiaZimbabwe línea de tiempo (timeline):
En esta escala de tiempo se presenta un gráfico de 1982 y 2016 de IDA blend. Los datos de 1981 están ausentes. El número de observaciones reales por fecha: 35.
Fuente (nombre):
Indicadores del desarrollo mundial
Fuente (organización):
World Bank national accounts data, and OECD National Accounts data files.
Categorías:
Economy & Growth
Se ha actualizado:
23 abr 2017 año
Los indicadores de los cambios de valor en los últimos años
Mínimo:
234.281 bn
1 ene 1984 año
Máximo:
1.031 billones
1 ene 2016 año
A la fecha de observación
Valor
Cambio absoluto
El cambio con respecto al valor anterior
1 ene 1982 año
236.235 bn
+236.235 bn
0.0%
1 ene 1983 año
238.486 bn
+2.251 bn
0.95%
1 ene 1984 año
234.281 bn
-4.205 bn
-1.76%
1 ene 1985 año
236.948 bn
+2.666 bn
1.14%
1 ene 1986 año
257.393 bn
+20.445 bn
8.63%
1 ene 1987 año
267.687 bn
+10.294 bn
4.0%
1 ene 1988 año
272.372 bn
+4.685 bn
1.75%
1 ene 1989 año
288.165 bn
+15.793 bn
5.8%
1 ene 1990 año
303.556 bn
+15.391 bn
5.34%
1 ene 1991 año
326.857 bn
+23.301 bn
7.68%
1 ene 1992 año
329.887 bn
+3.03 bn
0.93%
1 ene 1993 año
336.19 bn
+6.303 bn
1.91%
1 ene 1994 año
339.565 bn
+3.375 bn
1.0%
1 ene 1995 año
345.32 bn
+5.755 bn
1.69%
1 ene 1996 año
355.51 bn
+10.19 bn
2.95%
1 ene 1997 año
373.197 bn
+17.687 bn
4.98%
1 ene 1998 año
383.05 bn
+9.852 bn
2.64%
1 ene 1999 año
395.3 bn
+12.25 bn
3.2%
1 ene 2000 año
404.605 bn
+9.305 bn
2.35%
1 ene 2001 año
421.432 bn
+16.827 bn
4.16%
1 ene 2002 año
443.45 bn
+22.018 bn
5.22%
1 ene 2003 año
494.628 bn
+51.178 bn
11.54%
1 ene 2004 año
529.187 bn
+34.559 bn
6.99%
1 ene 2005 año
574.631 bn
+45.444 bn
8.59%
1 ene 2006 año
613.18 bn
+38.549 bn
6.71%
1 ene 2007 año
646.367 bn
+33.187 bn
5.41%
1 ene 2008 año
685.35 bn
+38.983 bn
6.03%
1 ene 2009 año
722.631 bn
+37.282 bn
5.44%
1 ene 2010 año
757.456 bn
+34.825 bn
4.82%
1 ene 2011 año
804.012 bn
+46.556 bn
6.15%
1 ene 2012 año
848.621 bn
+44.609 bn
5.55%
1 ene 2013 año
891.705 bn
+43.084 bn
5.08%
1 ene 2014 año
937.615 bn
+45.911 bn
5.15%
1 ene 2015 año
990.602 bn
+52.986 bn
5.65%
1 ene 2016 año
1.031 billones
+40.413 bn
4.08%
Ranking de los países por los datos estadísticos actuales


Comentarios: