29
/es/
es
AIzaSyAYiBZKx7MnpbEhh9jyipgxe19OcubqV5w
April 1, 2024
115862
Cuba
CUB
true
2
1
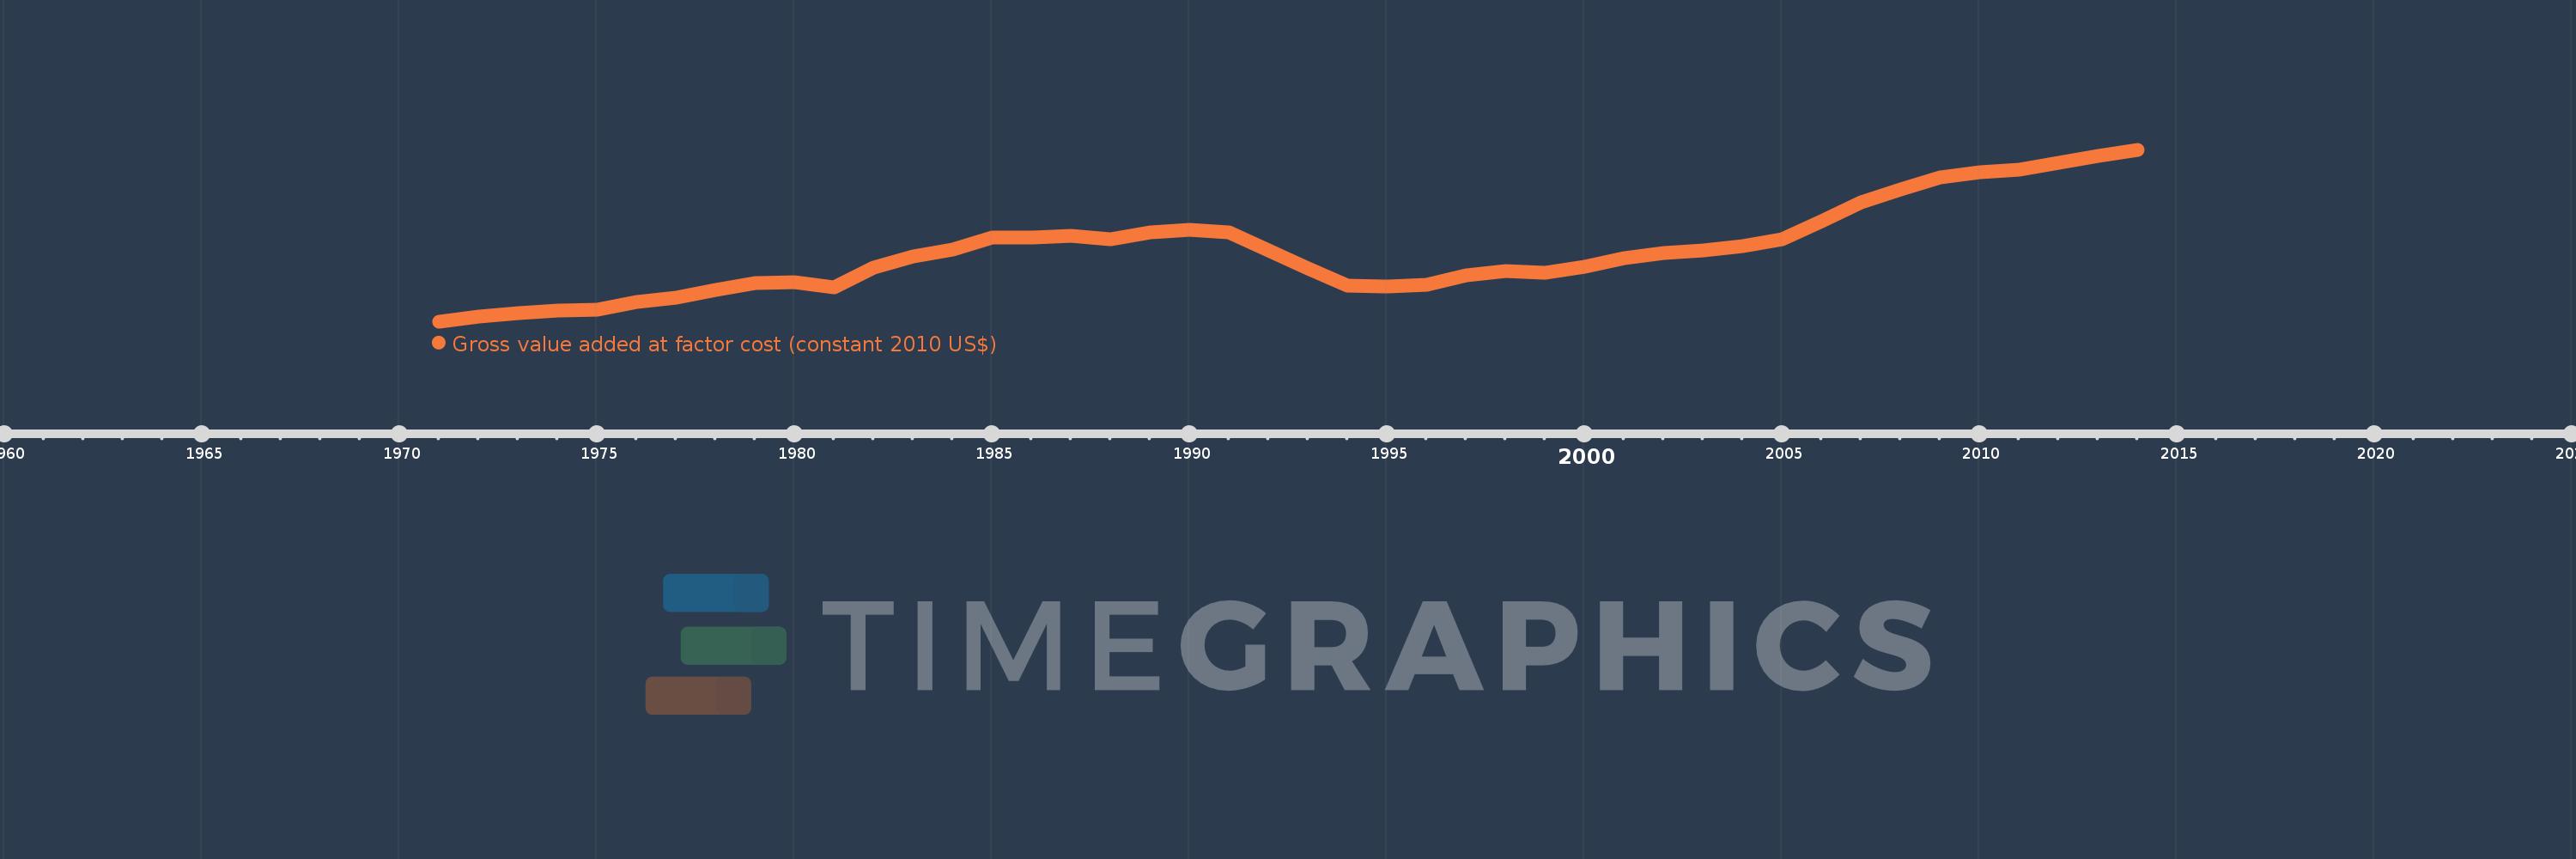
Gross value added at factor cost (constant 2010 US$)
2014,2013,2012,2011,2010,2009,2008,2007,2006,2005,2004,2003,2002,2001,2000,1999,1998,1997,1996,1995,1994,1993,1992,1991,1990,1989,1988,1987,1986,1985,1984,1983,1982,1981,1980,1979,1978,1977,1976,1975,1974,1973,1972,1971
Estas estadísticas en otros países:
AfghanistanAlbaniaAlgeriaAndorraAntigua and BarbudaArgentinaArmeniaArubaAustraliaAustriaAzerbaijanBahamas, TheBangladeshBarbadosBelarusBelgiumBelizeBeninBermudaBhutanBoliviaBosnia and HerzegovinaBotswanaBrazilBulgariaBurkina FasoBurundiCabo VerdeCambodiaCameroonCanadaCaribbean small statesCentral African RepublicCentral Europe and the BalticsChadChileColombiaCongo, Dem. Rep.Costa RicaCroatiaCubaCyprusCzech RepublicDenmarkDominicaDominican RepublicEarly-demographic dividendEcuadorEgypt, Arab Rep.El SalvadorEquatorial GuineaEstoniaEthiopiaEuro areaEurope & Central AsiaEurope & Central Asia (excluding high income)Europe & Central Asia (IDA & IBRD countries)European UnionFaroe IslandsFijiFinlandFranceGabonGambia, TheGeorgiaGermanyGhanaGreeceGrenadaGuatemalaGuineaGuinea-BissauGuyanaHeavily indebted poor countries (HIPC)High incomeHondurasHong Kong SAR, ChinaHungaryIcelandIDA blendIDA onlyIDA totalIndiaIndonesiaIran, Islamic Rep.IrelandItalyJamaicaJapanJordanKazakhstanKenyaKiribatiKorea, Rep.KosovoKuwaitKyrgyz RepublicLao PDRLatin America & Caribbean Latin America & Caribbean (excluding high income)Latin America & the Caribbean (IDA & IBRD countries)LatviaLeast developed countries: UN classificationLebanonLesothoLiechtensteinLithuaniaLow incomeLower middle incomeLuxembourgMacao SAR, ChinaMacedonia, FYRMadagascarMalawiMaldivesMaliMaltaMarshall IslandsMauritaniaMauritiusMexicoMicronesia, Fed. Sts.Middle East & North Africa (excluding high income)Middle East & North Africa (IDA & IBRD countries)MoldovaMongoliaMontenegroMoroccoMozambiqueNamibiaNepalNetherlandsNew ZealandNicaraguaNigeriaNorth AmericaNorwayOECD membersPacific island small statesPakistanPalauPanamaParaguayPeruPolandPortugalPost-demographic dividendPre-demographic dividendRomaniaRussian FederationRwandaSao Tome and PrincipeSenegalSerbiaSeychellesSierra LeoneSingaporeSlovak RepublicSloveniaSouth AfricaSouth AsiaSouth Asia (IDA & IBRD)SpainSri LankaSt. Kitts and NevisSt. LuciaSt. Vincent and the GrenadinesSub-Saharan Africa Sub-Saharan Africa (excluding high income)Sub-Saharan Africa (IDA & IBRD countries)SudanSurinameSwazilandSwedenSwitzerlandTajikistanTanzaniaThailandTimor-LesteTongaTrinidad and TobagoTunisiaTurkeyTurkmenistanTuvaluUgandaUkraineUnited KingdomUnited StatesUruguayUzbekistanVanuatuVenezuela, RBVietnamWest Bank and GazaWorldZambiaZimbabwe línea de tiempo (timeline):
En esta escala de tiempo se presenta un gráfico de 1971 y 2014 de Cuba. Los datos de 1970 están ausentes. El número de observaciones reales por fecha: 44.
Fuente (nombre):
Indicadores del desarrollo mundial
Fuente (organización):
World Bank national accounts data, and OECD National Accounts data files.
Categorías:
Economy & Growth
Se ha actualizado:
23 abr 2017 año
Los indicadores de los cambios de valor en los últimos años
Mínimo:
16.106 bn
1 ene 1971 año
Máximo:
58.101 bn
1 ene 2014 año
A la fecha de observación
Valor
Cambio absoluto
El cambio con respecto al valor anterior
1 ene 1971 año
16.106 bn
+16.106 bn
0.0%
1 ene 1972 año
17.487 bn
+1.382 bn
8.58%
1 ene 1973 año
18.331 bn
+843.667 millones
4.82%
1 ene 1974 año
18.961 bn
+630.208 millones
3.44%
1 ene 1975 año
19.151 bn
+189.76 millones
1.0%
1 ene 1976 año
20.962 bn
+1.811 bn
9.46%
1 ene 1977 año
22.097 bn
+1.134 bn
5.41%
1 ene 1978 año
24.022 bn
+1.925 bn
8.71%
1 ene 1979 año
25.614 bn
+1.592 bn
6.63%
1 ene 1980 año
25.914 bn
+299.496 millones
1.17%
1 ene 1981 año
24.611 bn
-1.303 bn
-5.03%
1 ene 1982 año
29.455 bn
+4.844 bn
19.68%
1 ene 1983 año
32.112 bn
+2.657 bn
9.02%
1 ene 1984 año
33.908 bn
+1.795 bn
5.59%
1 ene 1985 año
36.716 bn
+2.809 bn
8.28%
1 ene 1986 año
36.738 bn
+21.612 millones
0.06%
1 ene 1987 año
37.111 bn
+373.18 millones
1.02%
1 ene 1988 año
36.43 bn
-681.155 millones
-1.84%
1 ene 1989 año
37.989 bn
+1.559 bn
4.28%
1 ene 1990 año
38.669 bn
+680.527 millones
1.79%
1 ene 1991 año
37.988 bn
-681.267 millones
-1.76%
1 ene 1992 año
33.596 bn
-4.392 bn
-11.56%
1 ene 1993 año
29.279 bn
-4.317 bn
-12.85%
1 ene 1994 año
25.078 bn
-4.202 bn
-14.35%
1 ene 1995 año
24.877 bn
-200.128 millones
-0.8%
1 ene 1996 año
25.301 bn
+423.127 millones
1.7%
1 ene 1997 año
27.43 bn
+2.13 bn
8.42%
1 ene 1998 año
28.482 bn
+1.052 bn
3.83%
1 ene 1999 año
28.194 bn
-288.197 millones
-1.01%
1 ene 2000 año
29.62 bn
+1.426 bn
5.06%
1 ene 2001 año
31.623 bn
+2.003 bn
6.76%
1 ene 2002 año
33.01 bn
+1.387 bn
4.39%
1 ene 2003 año
33.664 bn
+653.664 millones
1.98%
1 ene 2004 año
34.736 bn
+1.073 bn
3.19%
1 ene 2005 año
36.398 bn
+1.662 bn
4.78%
1 ene 2006 año
40.721 bn
+4.323 bn
11.88%
1 ene 2007 año
45.326 bn
+4.605 bn
11.31%
1 ene 2008 año
48.565 bn
+3.239 bn
7.15%
1 ene 2009 año
51.375 bn
+2.81 bn
5.79%
1 ene 2010 año
52.611 bn
+1.236 bn
2.41%
1 ene 2011 año
53.251 bn
+640.593 millones
1.22%
1 ene 2012 año
54.994 bn
+1.742 bn
3.27%
1 ene 2013 año
56.697 bn
+1.704 bn
3.1%
1 ene 2014 año
58.101 bn
+1.403 bn
2.48%
Ranking de los países por los datos estadísticos actuales


Comentarios: