29
/es/
es
AIzaSyAYiBZKx7MnpbEhh9jyipgxe19OcubqV5w
April 1, 2024
51906
North America
NAC
false
2
1
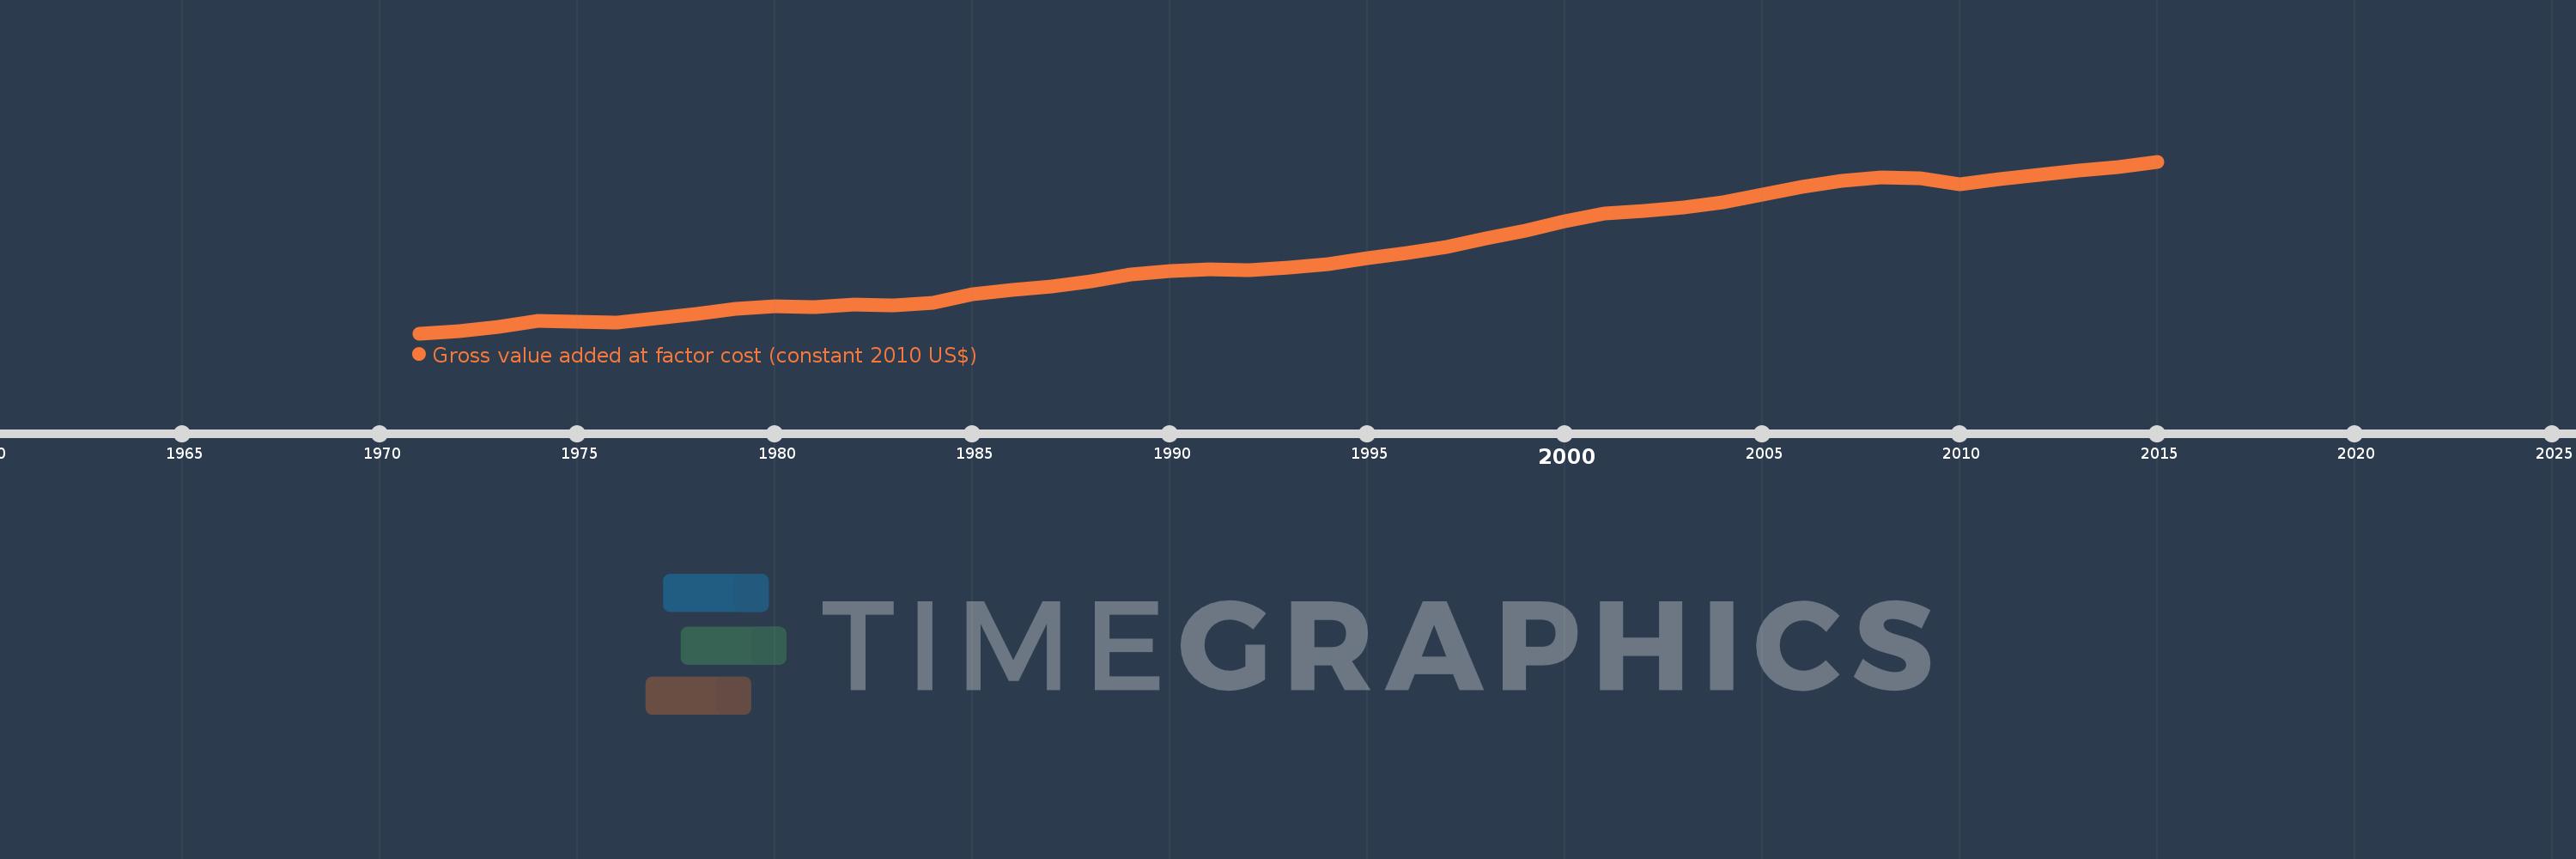
Gross value added at factor cost (constant 2010 US$)
2015,2014,2013,2012,2011,2010,2009,2008,2007,2006,2005,2004,2003,2002,2001,2000,1999,1998,1997,1996,1995,1994,1993,1992,1991,1990,1989,1988,1987,1986,1985,1984,1983,1982,1981,1980,1979,1978,1977,1976,1975,1974,1973,1972,1971
Estas estadísticas en otros países:
AfghanistanAlbaniaAlgeriaAndorraAntigua and BarbudaArgentinaArmeniaArubaAustraliaAustriaAzerbaijanBahamas, TheBangladeshBarbadosBelarusBelgiumBelizeBeninBermudaBhutanBoliviaBosnia and HerzegovinaBotswanaBrazilBulgariaBurkina FasoBurundiCabo VerdeCambodiaCameroonCanadaCaribbean small statesCentral African RepublicCentral Europe and the BalticsChadChileColombiaCongo, Dem. Rep.Costa RicaCroatiaCubaCyprusCzech RepublicDenmarkDominicaDominican RepublicEarly-demographic dividendEcuadorEgypt, Arab Rep.El SalvadorEquatorial GuineaEstoniaEthiopiaEuro areaEurope & Central AsiaEurope & Central Asia (excluding high income)Europe & Central Asia (IDA & IBRD countries)European UnionFaroe IslandsFijiFinlandFranceGabonGambia, TheGeorgiaGermanyGhanaGreeceGrenadaGuatemalaGuineaGuinea-BissauGuyanaHeavily indebted poor countries (HIPC)High incomeHondurasHong Kong SAR, ChinaHungaryIcelandIDA blendIDA onlyIDA totalIndiaIndonesiaIran, Islamic Rep.IrelandItalyJamaicaJapanJordanKazakhstanKenyaKiribatiKorea, Rep.KosovoKuwaitKyrgyz RepublicLao PDRLatin America & Caribbean Latin America & Caribbean (excluding high income)Latin America & the Caribbean (IDA & IBRD countries)LatviaLeast developed countries: UN classificationLebanonLesothoLiechtensteinLithuaniaLow incomeLower middle incomeLuxembourgMacao SAR, ChinaMacedonia, FYRMadagascarMalawiMaldivesMaliMaltaMarshall IslandsMauritaniaMauritiusMexicoMicronesia, Fed. Sts.Middle East & North Africa (excluding high income)Middle East & North Africa (IDA & IBRD countries)MoldovaMongoliaMontenegroMoroccoMozambiqueNamibiaNepalNetherlandsNew ZealandNicaraguaNigeriaNorth AmericaNorwayOECD membersPacific island small statesPakistanPalauPanamaParaguayPeruPolandPortugalPost-demographic dividendPre-demographic dividendRomaniaRussian FederationRwandaSao Tome and PrincipeSenegalSerbiaSeychellesSierra LeoneSingaporeSlovak RepublicSloveniaSouth AfricaSouth AsiaSouth Asia (IDA & IBRD)SpainSri LankaSt. Kitts and NevisSt. LuciaSt. Vincent and the GrenadinesSub-Saharan Africa Sub-Saharan Africa (excluding high income)Sub-Saharan Africa (IDA & IBRD countries)SudanSurinameSwazilandSwedenSwitzerlandTajikistanTanzaniaThailandTimor-LesteTongaTrinidad and TobagoTunisiaTurkeyTurkmenistanTuvaluUgandaUkraineUnited KingdomUnited StatesUruguayUzbekistanVanuatuVenezuela, RBVietnamWest Bank and GazaWorldZambiaZimbabwe línea de tiempo (timeline):
En esta escala de tiempo se presenta un gráfico de 1971 y 2015 de North America. Los datos de 1970 están ausentes. El número de observaciones reales por fecha: 45.
Fuente (nombre):
Indicadores del desarrollo mundial
Fuente (organización):
World Bank national accounts data, and OECD National Accounts data files.
Categorías:
Economy & Growth
Se ha actualizado:
23 abr 2017 año
Los indicadores de los cambios de valor en los últimos años
En promedio:
11.027 billones
Mínimo:
5.75 billones
1 ene 1971 año
Máximo:
17.179 billones
1 ene 2015 año
A la fecha de observación
Valor
Cambio absoluto
El cambio con respecto al valor anterior
1 ene 1971 año
5.75 billones
+5.75 billones
0.0%
1 ene 1972 año
5.875 billones
+124.799 bn
2.17%
1 ene 1973 año
6.193 billones
+317.249 bn
5.4%
1 ene 1974 año
6.555 billones
+362.642 bn
5.86%
1 ene 1975 año
6.536 billones
-19.255 bn
-0.29%
1 ene 1976 año
6.441 billones
-94.671 bn
-1.45%
1 ene 1977 año
6.75 billones
+308.299 bn
4.79%
1 ene 1978 año
7.048 billones
+298.238 bn
4.42%
1 ene 1979 año
7.365 billones
+317.613 bn
4.51%
1 ene 1980 año
7.548 billones
+182.39 bn
2.48%
1 ene 1981 año
7.505 billones
-43.198 bn
-0.57%
1 ene 1982 año
7.675 billones
+170.049 bn
2.27%
1 ene 1983 año
7.606 billones
-68.811 bn
-0.9%
1 ene 1984 año
7.786 billones
+179.923 bn
2.37%
1 ene 1985 año
8.331 billones
+545.447 bn
7.01%
1 ene 1986 año
8.642 billones
+310.746 bn
3.73%
1 ene 1987 año
8.864 billones
+222.509 bn
2.57%
1 ene 1988 año
9.191 billones
+326.869 bn
3.69%
1 ene 1989 año
9.657 billones
+465.398 bn
5.06%
1 ene 1990 año
9.871 billones
+214.108 bn
2.22%
1 ene 1991 año
9.996 billones
+125.599 bn
1.27%
1 ene 1992 año
9.933 billones
-63.736 bn
-0.64%
1 ene 1993 año
10.136 billones
+203.287 bn
2.05%
1 ene 1994 año
10.351 billones
+214.768 bn
2.12%
1 ene 1995 año
10.762 billones
+411.548 bn
3.98%
1 ene 1996 año
11.11 billones
+347.511 bn
3.23%
1 ene 1997 año
11.516 billones
+406.382 bn
3.66%
1 ene 1998 año
12.079 billones
+562.884 bn
4.89%
1 ene 1999 año
12.592 billones
+512.876 bn
4.25%
1 ene 2000 año
13.197 billones
+604.771 bn
4.8%
1 ene 2001 año
13.734 billones
+536.933 bn
4.07%
1 ene 2002 año
13.872 billones
+138.681 bn
1.01%
1 ene 2003 año
14.131 billones
+258.892 bn
1.87%
1 ene 2004 año
14.488 billones
+356.815 bn
2.53%
1 ene 2005 año
14.992 billones
+503.897 bn
3.48%
1 ene 2006 año
15.478 billones
+486.477 bn
3.24%
1 ene 2007 año
15.894 billones
+416.116 bn
2.69%
1 ene 2008 año
16.148 billones
+253.547 bn
1.6%
1 ene 2009 año
16.085 billones
-63.32 bn
-0.39%
1 ene 2010 año
15.664 billones
-420.459 bn
-2.61%
1 ene 2011 año
16.025 billones
+360.429 bn
2.3%
1 ene 2012 año
16.273 billones
+248.553 bn
1.55%
1 ene 2013 año
16.592 billones
+318.876 bn
1.96%
1 ene 2014 año
16.813 billones
+221.039 bn
1.33%
1 ene 2015 año
17.179 billones
+366.216 bn
2.18%
Ranking de los países por los datos estadísticos actuales


Comentarios: