29
/es/
es
AIzaSyAYiBZKx7MnpbEhh9jyipgxe19OcubqV5w
April 1, 2024
213035
Nigeria
NGA
true
2
1
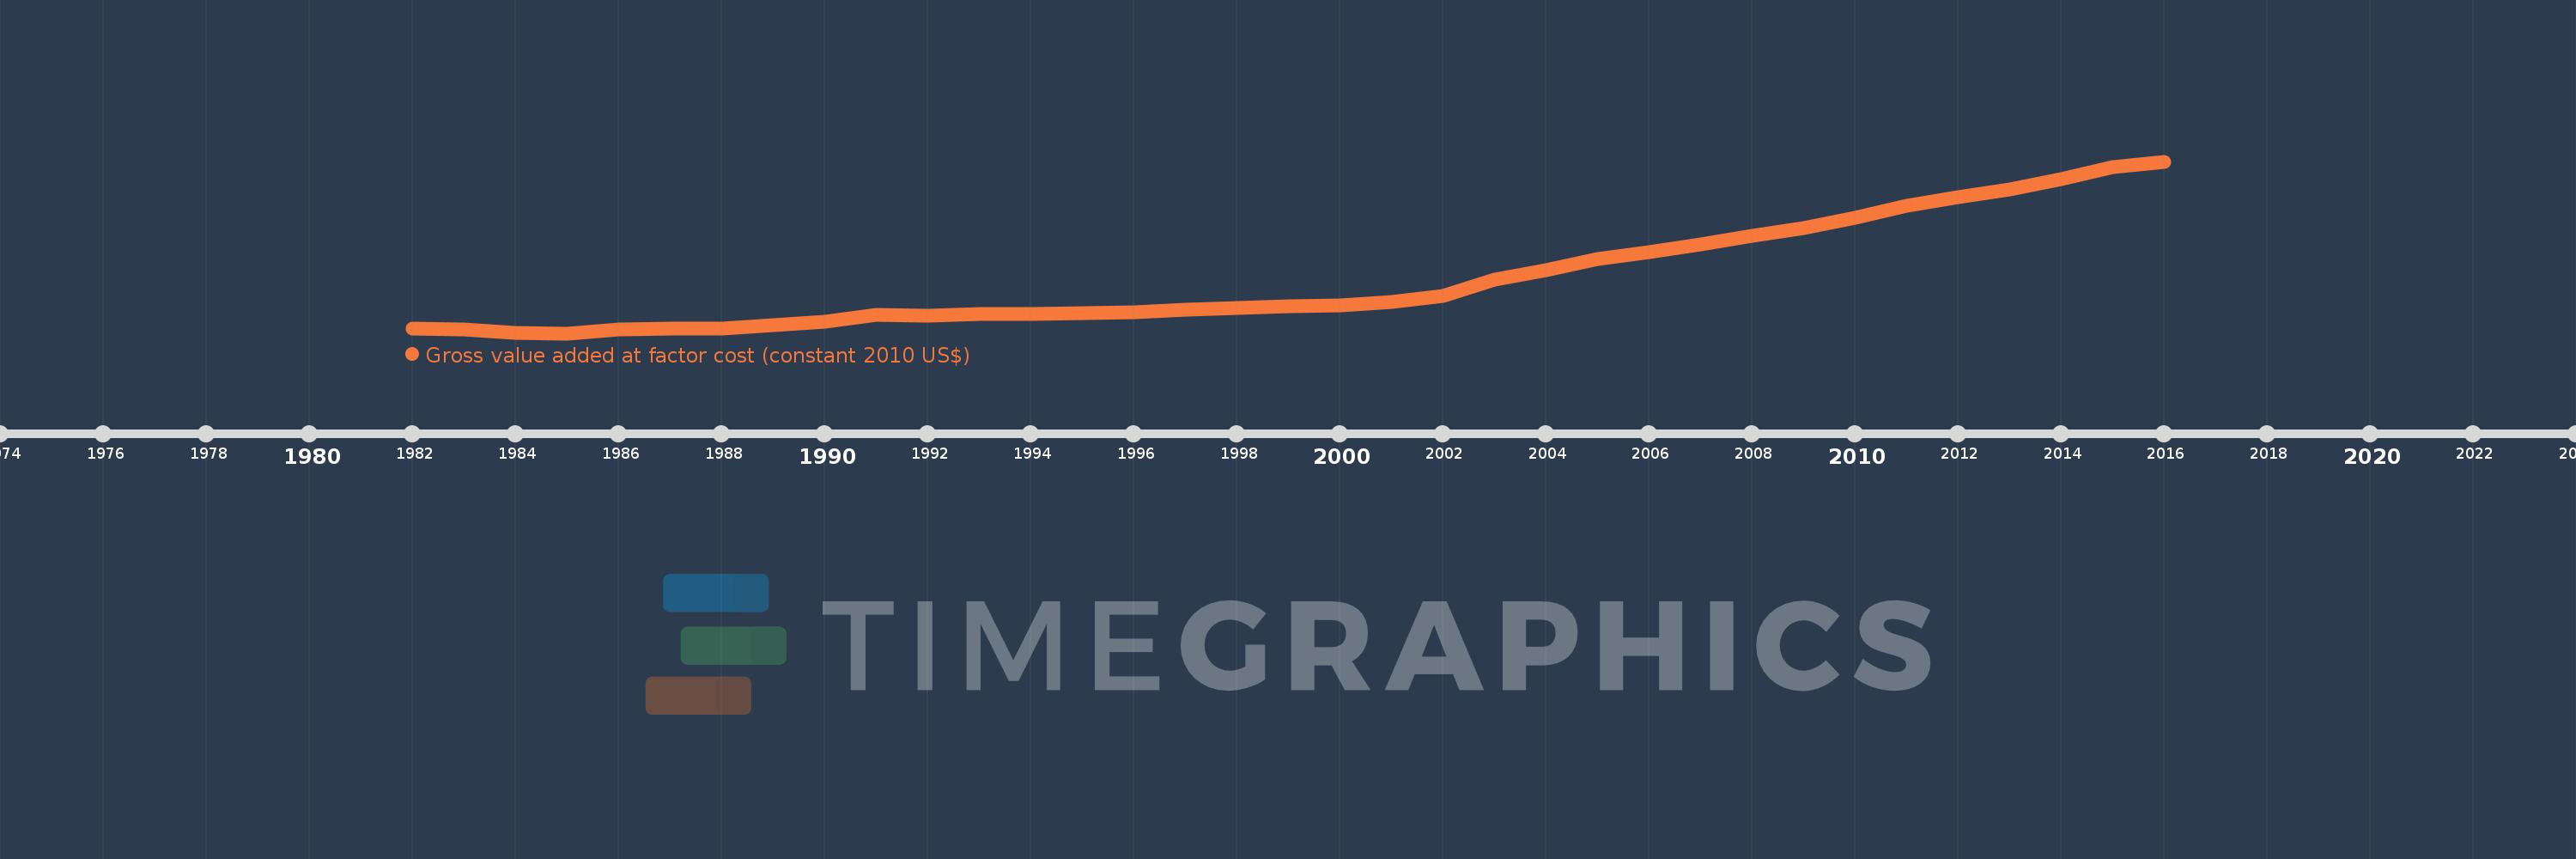
Gross value added at factor cost (constant 2010 US$)
2016,2015,2014,2013,2012,2011,2010,2009,2008,2007,2006,2005,2004,2003,2002,2001,2000,1999,1998,1997,1996,1995,1994,1993,1992,1991,1990,1989,1988,1987,1986,1985,1984,1983,1982
Estas estadísticas en otros países:
AfghanistanAlbaniaAlgeriaAndorraAntigua and BarbudaArgentinaArmeniaArubaAustraliaAustriaAzerbaijanBahamas, TheBangladeshBarbadosBelarusBelgiumBelizeBeninBermudaBhutanBoliviaBosnia and HerzegovinaBotswanaBrazilBulgariaBurkina FasoBurundiCabo VerdeCambodiaCameroonCanadaCaribbean small statesCentral African RepublicCentral Europe and the BalticsChadChileColombiaCongo, Dem. Rep.Costa RicaCroatiaCubaCyprusCzech RepublicDenmarkDominicaDominican RepublicEarly-demographic dividendEcuadorEgypt, Arab Rep.El SalvadorEquatorial GuineaEstoniaEthiopiaEuro areaEurope & Central AsiaEurope & Central Asia (excluding high income)Europe & Central Asia (IDA & IBRD countries)European UnionFaroe IslandsFijiFinlandFranceGabonGambia, TheGeorgiaGermanyGhanaGreeceGrenadaGuatemalaGuineaGuinea-BissauGuyanaHeavily indebted poor countries (HIPC)High incomeHondurasHong Kong SAR, ChinaHungaryIcelandIDA blendIDA onlyIDA totalIndiaIndonesiaIran, Islamic Rep.IrelandItalyJamaicaJapanJordanKazakhstanKenyaKiribatiKorea, Rep.KosovoKuwaitKyrgyz RepublicLao PDRLatin America & Caribbean Latin America & Caribbean (excluding high income)Latin America & the Caribbean (IDA & IBRD countries)LatviaLeast developed countries: UN classificationLebanonLesothoLiechtensteinLithuaniaLow incomeLower middle incomeLuxembourgMacao SAR, ChinaMacedonia, FYRMadagascarMalawiMaldivesMaliMaltaMarshall IslandsMauritaniaMauritiusMexicoMicronesia, Fed. Sts.Middle East & North Africa (excluding high income)Middle East & North Africa (IDA & IBRD countries)MoldovaMongoliaMontenegroMoroccoMozambiqueNamibiaNepalNetherlandsNew ZealandNicaraguaNigeriaNorth AmericaNorwayOECD membersPacific island small statesPakistanPalauPanamaParaguayPeruPolandPortugalPost-demographic dividendPre-demographic dividendRomaniaRussian FederationRwandaSao Tome and PrincipeSenegalSerbiaSeychellesSierra LeoneSingaporeSlovak RepublicSloveniaSouth AfricaSouth AsiaSouth Asia (IDA & IBRD)SpainSri LankaSt. Kitts and NevisSt. LuciaSt. Vincent and the GrenadinesSub-Saharan Africa Sub-Saharan Africa (excluding high income)Sub-Saharan Africa (IDA & IBRD countries)SudanSurinameSwazilandSwedenSwitzerlandTajikistanTanzaniaThailandTimor-LesteTongaTrinidad and TobagoTunisiaTurkeyTurkmenistanTuvaluUgandaUkraineUnited KingdomUnited StatesUruguayUzbekistanVanuatuVenezuela, RBVietnamWest Bank and GazaWorldZambiaZimbabwe línea de tiempo (timeline):
En esta escala de tiempo se presenta un gráfico de 1982 y 2016 de Nigeria. Los datos de 1981 están ausentes. El número de observaciones reales por fecha: 35.
Fuente (nombre):
Indicadores del desarrollo mundial
Fuente (organización):
World Bank national accounts data, and OECD National Accounts data files.
Categorías:
Economy & Growth
Se ha actualizado:
23 abr 2017 año
Los indicadores de los cambios de valor en los últimos años
Mínimo:
85.916 bn
1 ene 1985 año
Máximo:
459.247 bn
1 ene 2016 año
A la fecha de observación
Valor
Cambio absoluto
El cambio con respecto al valor anterior
1 ene 1982 año
96.054 bn
+96.054 bn
0.0%
1 ene 1983 año
93.462 bn
-2.591 bn
-2.7%
1 ene 1984 año
86.869 bn
-6.593 bn
-7.05%
1 ene 1985 año
85.916 bn
-952.56 millones
-1.1%
1 ene 1986 año
94.094 bn
+8.178 bn
9.52%
1 ene 1987 año
96.404 bn
+2.31 bn
2.45%
1 ene 1988 año
95.859 bn
-545.228 millones
-0.57%
1 ene 1989 año
102.912 bn
+7.053 bn
7.36%
1 ene 1990 año
110.801 bn
+7.888 bn
7.67%
1 ene 1991 año
125.226 bn
+14.425 bn
13.02%
1 ene 1992 año
124.21 bn
-1.016 bn
-0.81%
1 ene 1993 año
127.012 bn
+2.802 bn
2.26%
1 ene 1994 año
128.635 bn
+1.623 bn
1.28%
1 ene 1995 año
128.924 bn
+288.907 millones
0.22%
1 ene 1996 año
131.712 bn
+2.788 bn
2.16%
1 ene 1997 año
137.487 bn
+5.775 bn
4.38%
1 ene 1998 año
141.361 bn
+3.874 bn
2.82%
1 ene 1999 año
145.511 bn
+4.15 bn
2.94%
1 ene 2000 año
146.117 bn
+605.377 millones
0.42%
1 ene 2001 año
154.071 bn
+7.955 bn
5.44%
1 ene 2002 año
167.09 bn
+13.019 bn
8.45%
1 ene 2003 año
202.76 bn
+35.669 bn
21.35%
1 ene 2004 año
223.508 bn
+20.748 bn
10.23%
1 ene 2005 año
246.93 bn
+23.422 bn
10.48%
1 ene 2006 año
263.01 bn
+16.08 bn
6.51%
1 ene 2007 año
278.872 bn
+15.862 bn
6.03%
1 ene 2008 año
296.859 bn
+17.987 bn
6.45%
1 ene 2009 año
314.622 bn
+17.763 bn
5.98%
1 ene 2010 año
336.515 bn
+21.893 bn
6.96%
1 ene 2011 año
363.36 bn
+26.845 bn
7.98%
1 ene 2012 año
382.647 bn
+19.287 bn
5.31%
1 ene 2013 año
398.74 bn
+16.094 bn
4.21%
1 ene 2014 año
420.623 bn
+21.882 bn
5.49%
1 ene 2015 año
446.798 bn
+26.175 bn
6.22%
1 ene 2016 año
459.247 bn
+12.45 bn
2.79%
Ranking de los países por los datos estadísticos actuales


Comentarios: