29
/es/
es
AIzaSyAYiBZKx7MnpbEhh9jyipgxe19OcubqV5w
April 1, 2024
247623
Spain
ESP
true
2
1
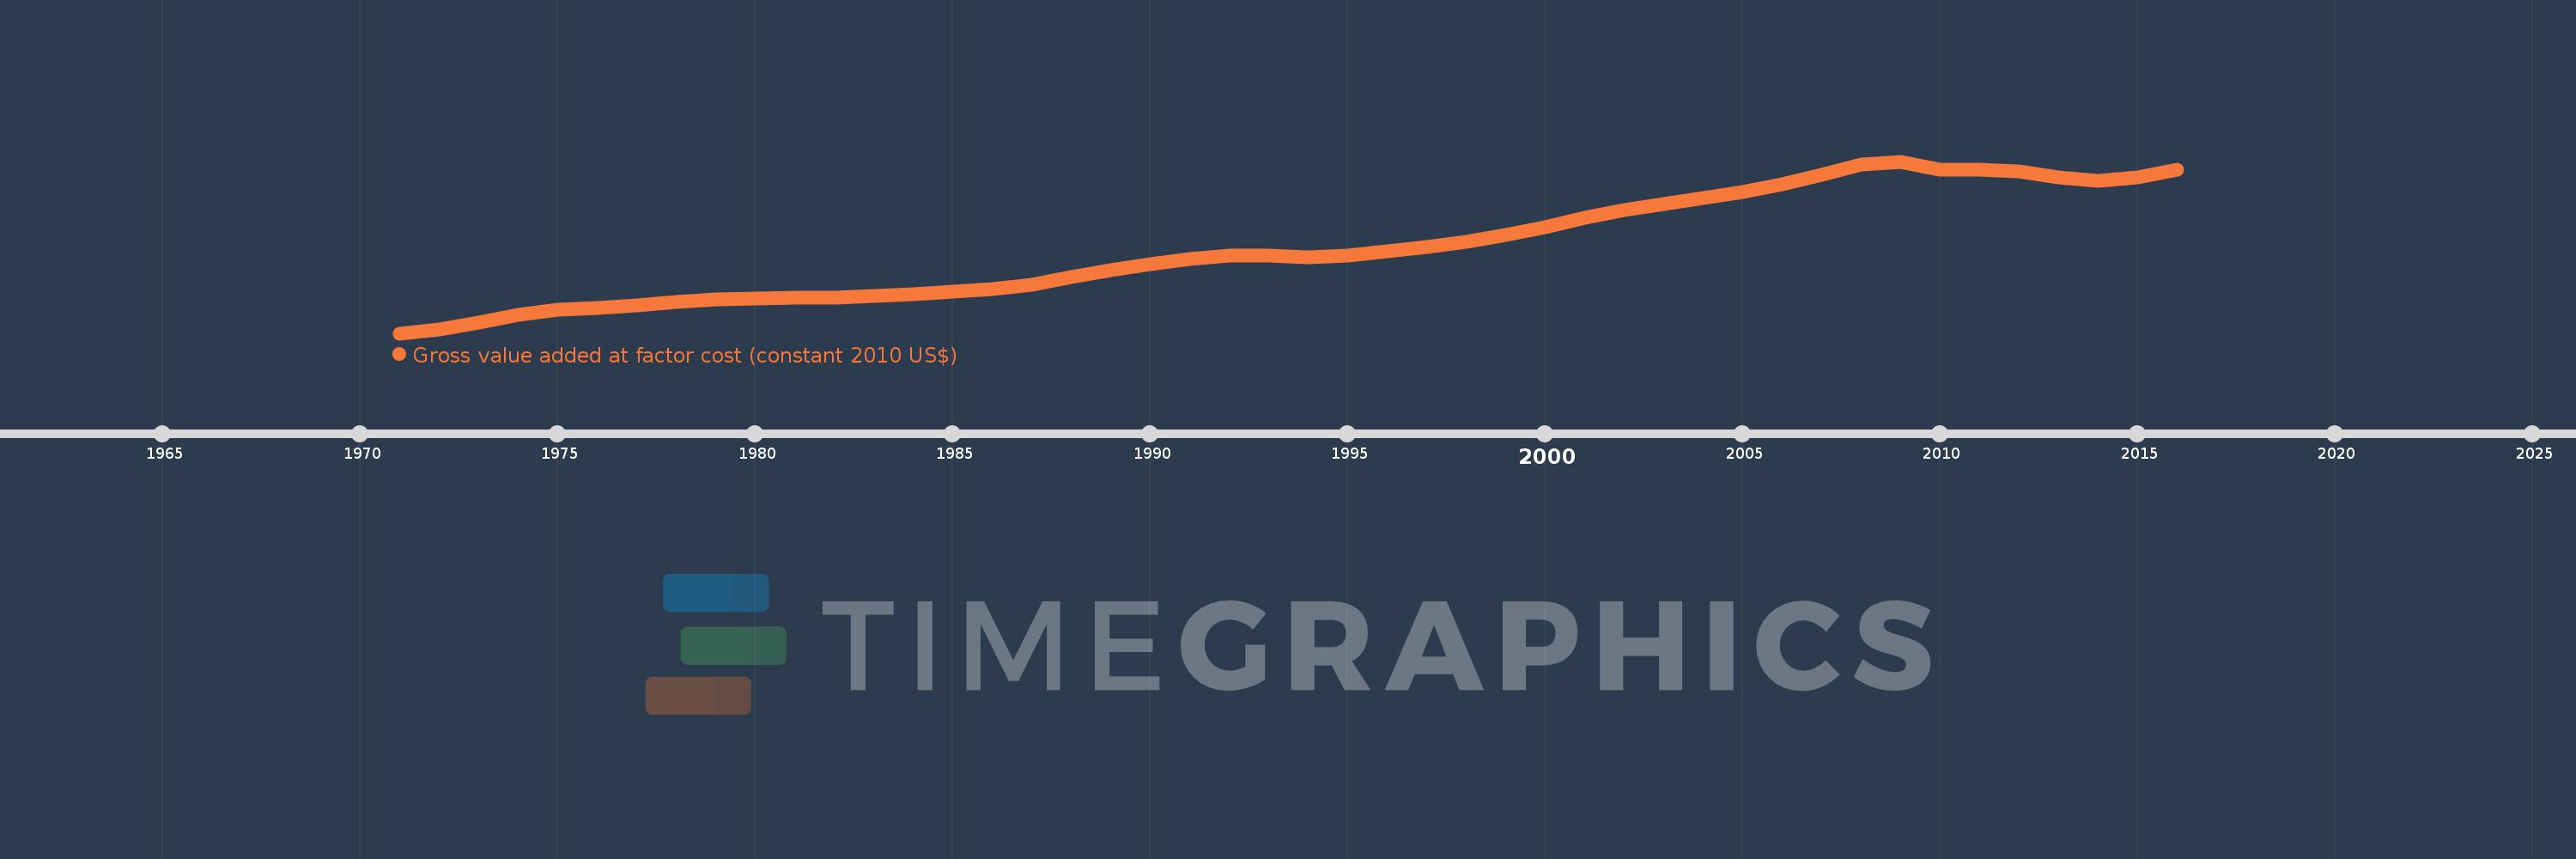
Gross value added at factor cost (constant 2010 US$)
2016,2015,2014,2013,2012,2011,2010,2009,2008,2007,2006,2005,2004,2003,2002,2001,2000,1999,1998,1997,1996,1995,1994,1993,1992,1991,1990,1989,1988,1987,1986,1985,1984,1983,1982,1981,1980,1979,1978,1977,1976,1975,1974,1973,1972,1971
Estas estadísticas en otros países:
AfghanistanAlbaniaAlgeriaAndorraAntigua and BarbudaArgentinaArmeniaArubaAustraliaAustriaAzerbaijanBahamas, TheBangladeshBarbadosBelarusBelgiumBelizeBeninBermudaBhutanBoliviaBosnia and HerzegovinaBotswanaBrazilBulgariaBurkina FasoBurundiCabo VerdeCambodiaCameroonCanadaCaribbean small statesCentral African RepublicCentral Europe and the BalticsChadChileColombiaCongo, Dem. Rep.Costa RicaCroatiaCubaCyprusCzech RepublicDenmarkDominicaDominican RepublicEarly-demographic dividendEcuadorEgypt, Arab Rep.El SalvadorEquatorial GuineaEstoniaEthiopiaEuro areaEurope & Central AsiaEurope & Central Asia (excluding high income)Europe & Central Asia (IDA & IBRD countries)European UnionFaroe IslandsFijiFinlandFranceGabonGambia, TheGeorgiaGermanyGhanaGreeceGrenadaGuatemalaGuineaGuinea-BissauGuyanaHeavily indebted poor countries (HIPC)High incomeHondurasHong Kong SAR, ChinaHungaryIcelandIDA blendIDA onlyIDA totalIndiaIndonesiaIran, Islamic Rep.IrelandItalyJamaicaJapanJordanKazakhstanKenyaKiribatiKorea, Rep.KosovoKuwaitKyrgyz RepublicLao PDRLatin America & Caribbean Latin America & Caribbean (excluding high income)Latin America & the Caribbean (IDA & IBRD countries)LatviaLeast developed countries: UN classificationLebanonLesothoLiechtensteinLithuaniaLow incomeLower middle incomeLuxembourgMacao SAR, ChinaMacedonia, FYRMadagascarMalawiMaldivesMaliMaltaMarshall IslandsMauritaniaMauritiusMexicoMicronesia, Fed. Sts.Middle East & North Africa (excluding high income)Middle East & North Africa (IDA & IBRD countries)MoldovaMongoliaMontenegroMoroccoMozambiqueNamibiaNepalNetherlandsNew ZealandNicaraguaNigeriaNorth AmericaNorwayOECD membersPacific island small statesPakistanPalauPanamaParaguayPeruPolandPortugalPost-demographic dividendPre-demographic dividendRomaniaRussian FederationRwandaSao Tome and PrincipeSenegalSerbiaSeychellesSierra LeoneSingaporeSlovak RepublicSloveniaSouth AfricaSouth AsiaSouth Asia (IDA & IBRD)SpainSri LankaSt. Kitts and NevisSt. LuciaSt. Vincent and the GrenadinesSub-Saharan Africa Sub-Saharan Africa (excluding high income)Sub-Saharan Africa (IDA & IBRD countries)SudanSurinameSwazilandSwedenSwitzerlandTajikistanTanzaniaThailandTimor-LesteTongaTrinidad and TobagoTunisiaTurkeyTurkmenistanTuvaluUgandaUkraineUnited KingdomUnited StatesUruguayUzbekistanVanuatuVenezuela, RBVietnamWest Bank and GazaWorldZambiaZimbabwe línea de tiempo (timeline):
En esta escala de tiempo se presenta un gráfico de 1971 y 2016 de Spain. Los datos de 1970 están ausentes. El número de observaciones reales por fecha: 46.
Fuente (nombre):
Indicadores del desarrollo mundial
Fuente (organización):
World Bank national accounts data, and OECD National Accounts data files.
Categorías:
Economy & Growth
Se ha actualizado:
23 abr 2017 año
Los indicadores de los cambios de valor en los últimos años
Mínimo:
416.192 bn
1 ene 1971 año
Máximo:
1.357 billones
1 ene 2009 año
A la fecha de observación
Valor
Cambio absoluto
El cambio con respecto al valor anterior
1 ene 1971 año
416.192 bn
+416.192 bn
0.0%
1 ene 1972 año
439.256 bn
+23.065 bn
5.54%
1 ene 1973 año
476.956 bn
+37.7 bn
8.58%
1 ene 1974 año
515.403 bn
+38.447 bn
8.06%
1 ene 1975 año
545.959 bn
+30.556 bn
5.93%
1 ene 1976 año
553.138 bn
+7.178 bn
1.31%
1 ene 1977 año
571.231 bn
+18.094 bn
3.27%
1 ene 1978 año
588.925 bn
+17.694 bn
3.1%
1 ene 1979 año
603.63 bn
+14.704 bn
2.5%
1 ene 1980 año
604.568 bn
+938.582 millones
0.16%
1 ene 1981 año
613.52 bn
+8.951 bn
1.48%
1 ene 1982 año
613.511 bn
-8.203 millones
0.0%
1 ene 1983 año
620.761 bn
+7.249 bn
1.18%
1 ene 1984 año
632.384 bn
+11.623 bn
1.87%
1 ene 1985 año
643.48 bn
+11.096 bn
1.75%
1 ene 1986 año
657.663 bn
+14.183 bn
2.2%
1 ene 1987 año
683.083 bn
+25.42 bn
3.87%
1 ene 1988 año
722.089 bn
+39.006 bn
5.71%
1 ene 1989 año
759.795 bn
+37.706 bn
5.22%
1 ene 1990 año
795.063 bn
+35.268 bn
4.64%
1 ene 1991 año
824.668 bn
+29.606 bn
3.72%
1 ene 1992 año
843.451 bn
+18.782 bn
2.28%
1 ene 1993 año
843.926 bn
+475.759 millones
0.06%
1 ene 1994 año
831.536 bn
-12.39 bn
-1.47%
1 ene 1995 año
844.08 bn
+12.544 bn
1.51%
1 ene 1996 año
866.109 bn
+22.028 bn
2.61%
1 ene 1997 año
888.434 bn
+22.326 bn
2.58%
1 ene 1998 año
918.74 bn
+30.306 bn
3.41%
1 ene 1999 año
955.305 bn
+36.564 bn
3.98%
1 ene 2000 año
995.846 bn
+40.542 bn
4.24%
1 ene 2001 año
1.05 billones
+54.0 bn
5.42%
1 ene 2002 año
1.093 billones
+43.107 bn
4.11%
1 ene 2003 año
1.124 billones
+31.008 bn
2.84%
1 ene 2004 año
1.156 billones
+31.76 bn
2.83%
1 ene 2005 año
1.189 billones
+33.511 bn
2.9%
1 ene 2006 año
1.231 billones
+41.993 bn
3.53%
1 ene 2007 año
1.285 billones
+53.461 bn
4.34%
1 ene 2008 año
1.339 billones
+54.135 bn
4.21%
1 ene 2009 año
1.357 billones
+17.923 bn
1.34%
1 ene 2010 año
1.311 billones
-45.739 bn
-3.37%
1 ene 2011 año
1.311 billones
+136.424 millones
0.01%
1 ene 2012 año
1.304 billones
-7.621 bn
-0.58%
1 ene 2013 año
1.271 billones
-32.113 bn
-2.46%
1 ene 2014 año
1.251 billones
-19.913 bn
-1.57%
1 ene 2015 año
1.269 billones
+17.656 bn
1.41%
1 ene 2016 año
1.31 billones
+41.317 bn
3.26%
Ranking de los países por los datos estadísticos actuales


Comentarios: