29
/es/
es
AIzaSyAYiBZKx7MnpbEhh9jyipgxe19OcubqV5w
April 1, 2024
85381
Bermuda
BMU
true
2
1
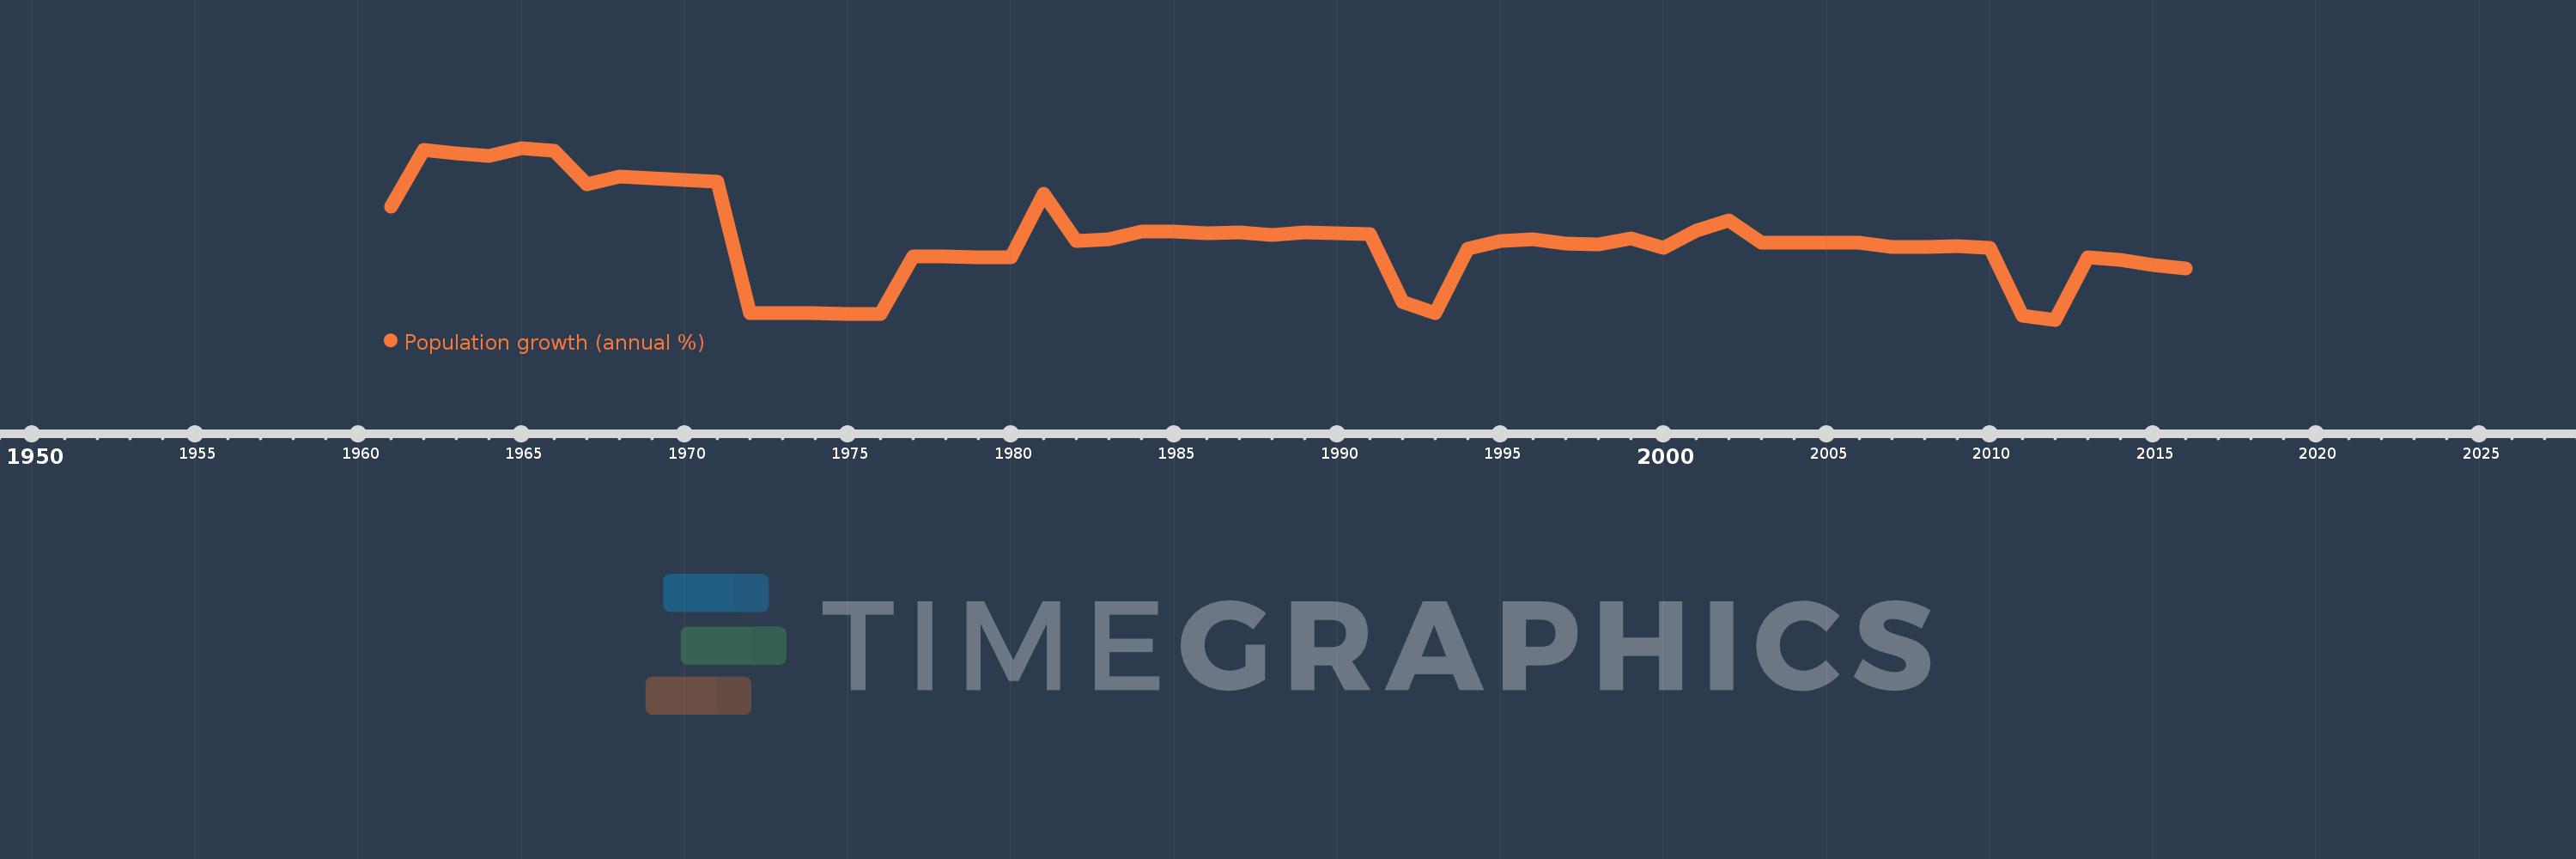
Population growth (annual %)
2016,2015,2014,2013,2012,2011,2010,2009,2008,2007,2006,2005,2004,2003,2002,2001,2000,1999,1998,1997,1996,1995,1994,1993,1992,1991,1990,1989,1988,1987,1986,1985,1984,1983,1982,1981,1980,1979,1978,1977,1976,1975,1974,1973,1972,1971,1970,1969,1968,1967,1966,1965,1964,1963,1962,1961
Estas estadísticas en otros países:
AfghanistanAlbaniaAlgeriaAmerican SamoaAndorraAngolaAntigua and BarbudaArab WorldArgentinaArmeniaArubaAustraliaAustriaAzerbaijanBahamas, TheBahrainBangladeshBarbadosBelarusBelgiumBelizeBeninBermudaBhutanBoliviaBosnia and HerzegovinaBotswanaBrazilBritish Virgin IslandsBrunei DarussalamBulgariaBurkina FasoBurundiCabo VerdeCambodiaCameroonCanadaCaribbean small statesCayman IslandsCentral African RepublicCentral Europe and the BalticsChadChannel IslandsChileChinaColombiaComorosCongo, Dem. Rep.Congo, Rep.Costa RicaCote d'IvoireCroatiaCubaCuracaoCyprusCzech RepublicDenmarkDjiboutiDominicaDominican RepublicEarly-demographic dividendEast Asia & PacificEast Asia & Pacific (excluding high income)East Asia & Pacific (IDA & IBRD countries)EcuadorEgypt, Arab Rep.El SalvadorEquatorial GuineaEritreaEstoniaEthiopiaEuro areaEurope & Central AsiaEurope & Central Asia (excluding high income)Europe & Central Asia (IDA & IBRD countries)European UnionFaroe IslandsFijiFinlandFragile and conflict affected situationsFranceFrench PolynesiaGabonGambia, TheGeorgiaGermanyGhanaGibraltarGreeceGreenlandGrenadaGuamGuatemalaGuineaGuinea-BissauGuyanaHaitiHeavily indebted poor countries (HIPC)High incomeHondurasHong Kong SAR, ChinaHungaryIBRD onlyIcelandIDA & IBRD totalIDA blendIDA onlyIDA totalIndiaIndonesiaIran, Islamic Rep.IraqIrelandIsle of ManIsraelItalyJamaicaJapanJordanKazakhstanKenyaKiribatiKorea, Dem. People’s Rep.Korea, Rep.KosovoKuwaitKyrgyz RepublicLao PDRLate-demographic dividendLatin America & Caribbean Latin America & Caribbean (excluding high income)Latin America & the Caribbean (IDA & IBRD countries)LatviaLeast developed countries: UN classificationLebanonLesothoLiberiaLibyaLiechtensteinLithuaniaLow & middle incomeLow incomeLower middle incomeLuxembourgMacao SAR, ChinaMacedonia, FYRMadagascarMalawiMalaysiaMaldivesMaliMaltaMarshall IslandsMauritaniaMauritiusMexicoMicronesia, Fed. Sts.Middle East & North AfricaMiddle East & North Africa (excluding high income)Middle East & North Africa (IDA & IBRD countries)Middle incomeMoldovaMonacoMongoliaMontenegroMoroccoMozambiqueMyanmarNamibiaNauruNepalNetherlandsNew CaledoniaNew ZealandNicaraguaNigerNigeriaNorth AmericaNorthern Mariana IslandsNorwayOECD membersOmanOther small statesPacific island small statesPakistanPalauPanamaPapua New GuineaParaguayPeruPhilippinesPolandPortugalPost-demographic dividendPre-demographic dividendPuerto RicoQatarRomaniaRussian FederationRwandaSamoaSan MarinoSao Tome and PrincipeSaudi ArabiaSenegalSerbiaSeychellesSierra LeoneSingaporeSint Maarten (Dutch part)Slovak RepublicSloveniaSmall statesSolomon IslandsSomaliaSouth AfricaSouth AsiaSouth Asia (IDA & IBRD)South SudanSpainSri LankaSt. Kitts and NevisSt. LuciaSt. Martin (French part)St. Vincent and the GrenadinesSub-Saharan Africa Sub-Saharan Africa (excluding high income)Sub-Saharan Africa (IDA & IBRD countries)SudanSurinameSwazilandSwedenSwitzerlandSyrian Arab RepublicTajikistanTanzaniaThailandTimor-LesteTogoTongaTrinidad and TobagoTunisiaTurkeyTurkmenistanTurks and Caicos IslandsTuvaluUgandaUkraineUnited Arab EmiratesUnited KingdomUnited StatesUpper middle incomeUruguayUzbekistanVanuatuVenezuela, RBVietnamVirgin Islands (U.S.)West Bank and GazaWorldYemen, Rep.ZambiaZimbabwe línea de tiempo (timeline):
En esta escala de tiempo se presenta un gráfico de 1961 y 2016 de Bermuda. Los datos de 1960 están ausentes. El número de observaciones reales por fecha: 56.
Fuente (nombre):
Indicadores del desarrollo mundial
Fuente (organización):
Derived from total population. Population source: (1) United Nations Population Division. World Population Prospects, (2) United Nations Statistical Division. Population and Vital Statistics Report (various years), (3) Census reports and other statistical
Categorías:
Climate Change, Health
Se ha actualizado:
23 abr 2017 año
Los indicadores de los cambios de valor en los últimos años
Mínimo:
-0.86
1 ene 2012 año
Máximo:
2.516
1 ene 1965 año
A la fecha de observación
Valor
Cambio absoluto
El cambio con respecto al valor anterior
1 ene 1961 año
1.361
+1.361
0.0%
1 ene 1962 año
2.477
+1.117
82.09%
1 ene 1963 año
2.418
-0.06
-2.42%
1 ene 1964 año
2.361
-0.057
-2.36%
1 ene 1965 año
2.516
+0.155
6.58%
1 ene 1966 año
2.454
-0.062
-2.45%
1 ene 1967 año
1.796
-0.658
-26.8%
1 ene 1968 año
1.961
+0.164
9.15%
1 ene 1969 año
1.923
-0.038
-1.92%
1 ene 1970 año
1.887
-0.036
-1.89%
1 ene 1971 año
1.852
-0.035
-1.85%
1 ene 1972 año
-0.727
-2.579
-139.27%
1 ene 1973 año
-0.733
-0.005
0.73%
1 ene 1974 año
-0.738
-0.005
0.74%
1 ene 1975 año
-0.743
-0.005
0.74%
1 ene 1976 año
-0.749
-0.006
0.75%
1 ene 1977 año
0.377
+1.126
-150.38%
1 ene 1978 año
0.376
-0.001
-0.38%
1 ene 1979 año
0.375
-0.001
-0.37%
1 ene 1980 año
0.373
-0.001
-0.37%
1 ene 1981 año
1.617
+1.244
333.38%
1 ene 1982 año
0.695
-0.922
-57.02%
1 ene 1983 año
0.725
+0.03
4.28%
1 ene 1984 año
0.867
+0.143
19.68%
1 ene 1985 año
0.881
+0.014
1.61%
1 ene 1986 año
0.842
-0.04
-4.49%
1 ene 1987 año
0.851
+0.009
1.04%
1 ene 1988 año
0.814
-0.037
-4.33%
1 ene 1989 año
0.861
+0.047
5.78%
1 ene 1990 año
0.847
-0.014
-1.65%
1 ene 1991 año
0.824
-0.022
-2.65%
1 ene 1992 año
-0.514
-1.338
-162.37%
1 ene 1993 año
-0.722
-0.208
40.39%
1 ene 1994 año
0.538
+1.259
-174.48%
1 ene 1995 año
0.696
+0.158
29.46%
1 ene 1996 año
0.718
+0.022
3.18%
1 ene 1997 año
0.641
-0.077
-10.73%
1 ene 1998 año
0.612
-0.029
-4.53%
1 ene 1999 año
0.737
+0.125
20.46%
1 ene 2000 año
0.561
-0.176
-23.88%
1 ene 2001 año
0.894
+0.333
59.34%
1 ene 2002 año
1.085
+0.191
21.36%
1 ene 2003 año
0.653
-0.432
-39.85%
1 ene 2004 año
0.656
+0.004
0.57%
1 ene 2005 año
0.655
-0.001
-0.17%
1 ene 2006 año
0.65
-0.006
-0.89%
1 ene 2007 año
0.575
-0.074
-11.44%
1 ene 2008 año
0.566
-0.009
-1.65%
1 ene 2009 año
0.593
+0.028
4.89%
1 ene 2010 año
0.556
-0.037
-6.27%
1 ene 2011 año
-0.78
-1.336
-240.27%
1 ene 2012 año
-0.86
-0.08
10.23%
1 ene 2013 año
0.362
+1.222
-142.15%
1 ene 2014 año
0.313
-0.049
-13.56%
1 ene 2015 año
0.212
-0.101
-32.23%
1 ene 2016 año
0.147
-0.065
-30.58%
Ranking de los países por los datos estadísticos actuales


Comentarios: