29
/es/
es
AIzaSyAYiBZKx7MnpbEhh9jyipgxe19OcubqV5w
April 1, 2024
258790
Syrian Arab Republic
SYR
true
2
1
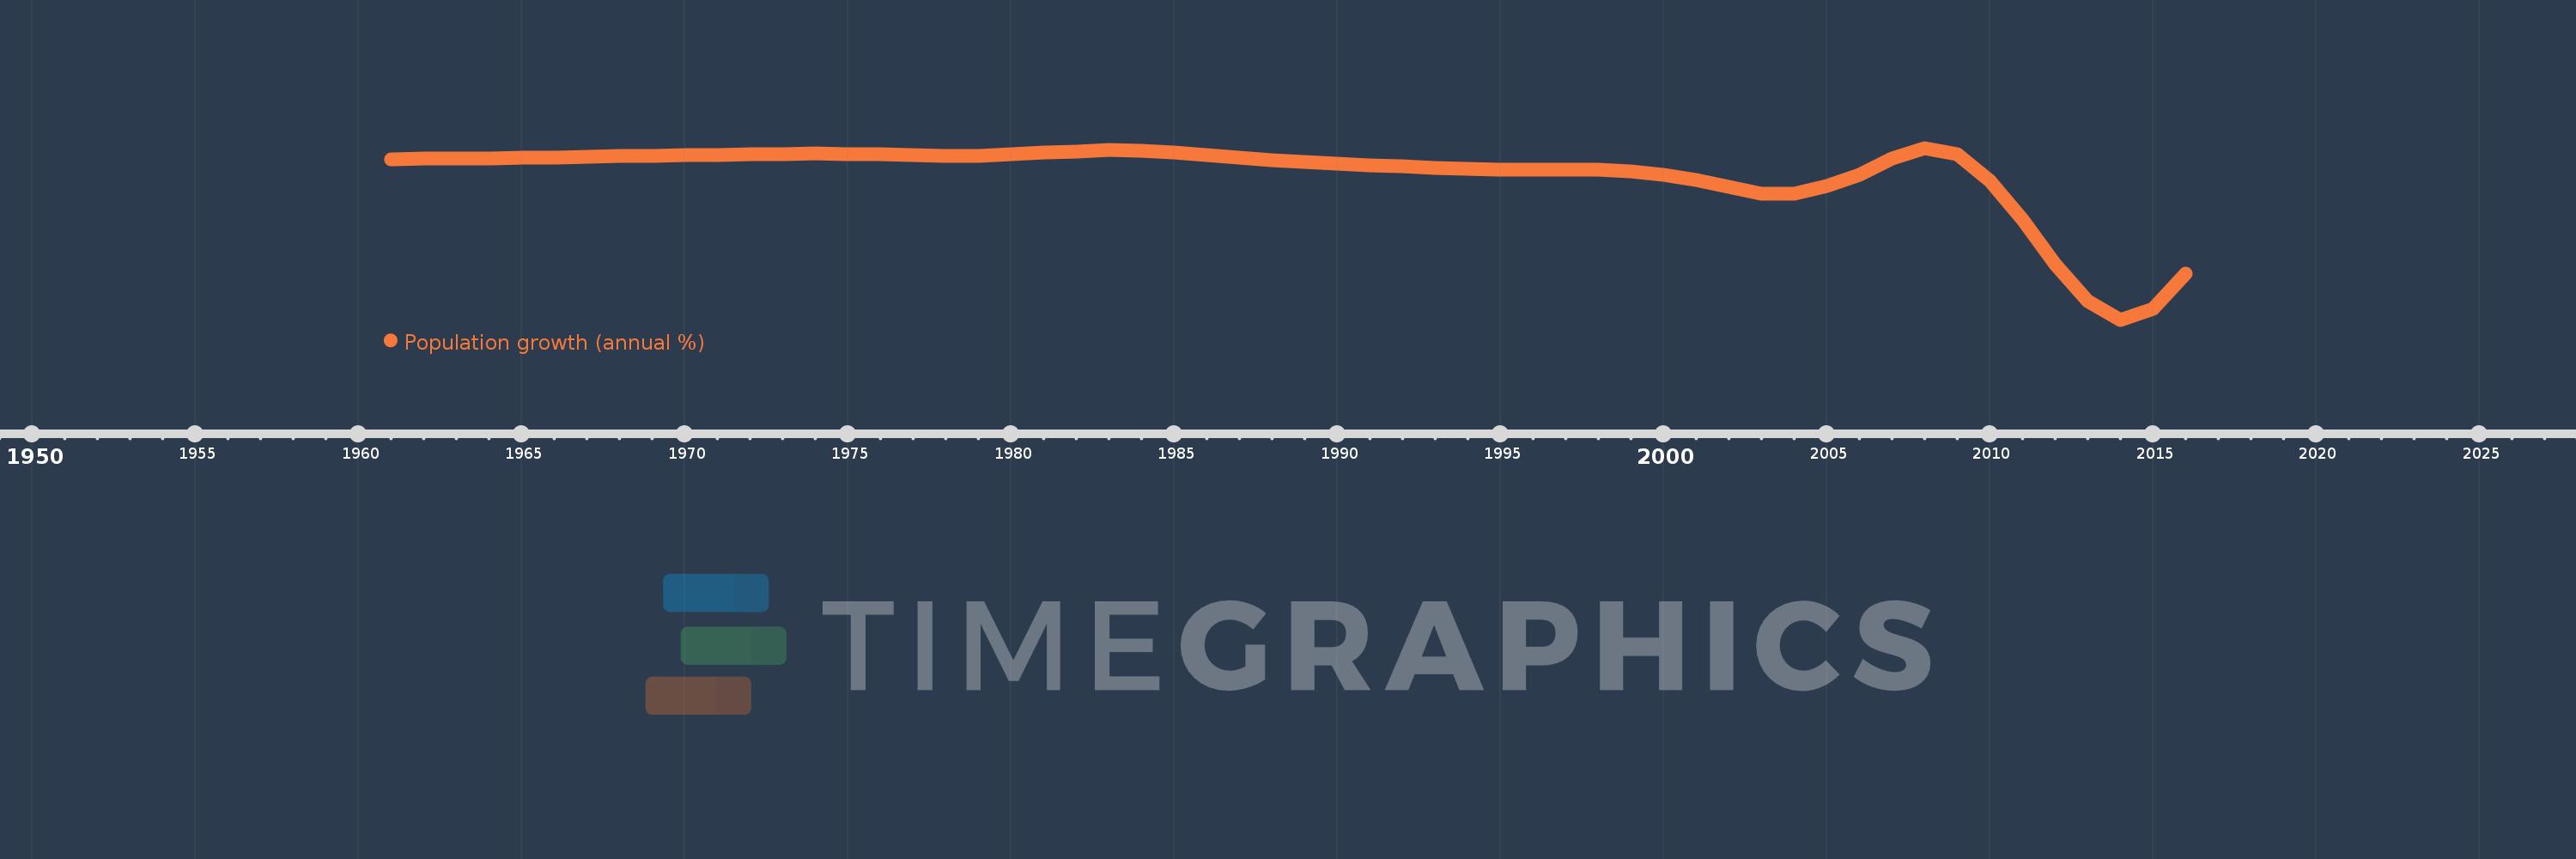
Population growth (annual %)
2016,2015,2014,2013,2012,2011,2010,2009,2008,2007,2006,2005,2004,2003,2002,2001,2000,1999,1998,1997,1996,1995,1994,1993,1992,1991,1990,1989,1988,1987,1986,1985,1984,1983,1982,1981,1980,1979,1978,1977,1976,1975,1974,1973,1972,1971,1970,1969,1968,1967,1966,1965,1964,1963,1962,1961
Estas estadísticas en otros países:
AfghanistanAlbaniaAlgeriaAmerican SamoaAndorraAngolaAntigua and BarbudaArab WorldArgentinaArmeniaArubaAustraliaAustriaAzerbaijanBahamas, TheBahrainBangladeshBarbadosBelarusBelgiumBelizeBeninBermudaBhutanBoliviaBosnia and HerzegovinaBotswanaBrazilBritish Virgin IslandsBrunei DarussalamBulgariaBurkina FasoBurundiCabo VerdeCambodiaCameroonCanadaCaribbean small statesCayman IslandsCentral African RepublicCentral Europe and the BalticsChadChannel IslandsChileChinaColombiaComorosCongo, Dem. Rep.Congo, Rep.Costa RicaCote d'IvoireCroatiaCubaCuracaoCyprusCzech RepublicDenmarkDjiboutiDominicaDominican RepublicEarly-demographic dividendEast Asia & PacificEast Asia & Pacific (excluding high income)East Asia & Pacific (IDA & IBRD countries)EcuadorEgypt, Arab Rep.El SalvadorEquatorial GuineaEritreaEstoniaEthiopiaEuro areaEurope & Central AsiaEurope & Central Asia (excluding high income)Europe & Central Asia (IDA & IBRD countries)European UnionFaroe IslandsFijiFinlandFragile and conflict affected situationsFranceFrench PolynesiaGabonGambia, TheGeorgiaGermanyGhanaGibraltarGreeceGreenlandGrenadaGuamGuatemalaGuineaGuinea-BissauGuyanaHaitiHeavily indebted poor countries (HIPC)High incomeHondurasHong Kong SAR, ChinaHungaryIBRD onlyIcelandIDA & IBRD totalIDA blendIDA onlyIDA totalIndiaIndonesiaIran, Islamic Rep.IraqIrelandIsle of ManIsraelItalyJamaicaJapanJordanKazakhstanKenyaKiribatiKorea, Dem. People’s Rep.Korea, Rep.KosovoKuwaitKyrgyz RepublicLao PDRLate-demographic dividendLatin America & Caribbean Latin America & Caribbean (excluding high income)Latin America & the Caribbean (IDA & IBRD countries)LatviaLeast developed countries: UN classificationLebanonLesothoLiberiaLibyaLiechtensteinLithuaniaLow & middle incomeLow incomeLower middle incomeLuxembourgMacao SAR, ChinaMacedonia, FYRMadagascarMalawiMalaysiaMaldivesMaliMaltaMarshall IslandsMauritaniaMauritiusMexicoMicronesia, Fed. Sts.Middle East & North AfricaMiddle East & North Africa (excluding high income)Middle East & North Africa (IDA & IBRD countries)Middle incomeMoldovaMonacoMongoliaMontenegroMoroccoMozambiqueMyanmarNamibiaNauruNepalNetherlandsNew CaledoniaNew ZealandNicaraguaNigerNigeriaNorth AmericaNorthern Mariana IslandsNorwayOECD membersOmanOther small statesPacific island small statesPakistanPalauPanamaPapua New GuineaParaguayPeruPhilippinesPolandPortugalPost-demographic dividendPre-demographic dividendPuerto RicoQatarRomaniaRussian FederationRwandaSamoaSan MarinoSao Tome and PrincipeSaudi ArabiaSenegalSerbiaSeychellesSierra LeoneSingaporeSint Maarten (Dutch part)Slovak RepublicSloveniaSmall statesSolomon IslandsSomaliaSouth AfricaSouth AsiaSouth Asia (IDA & IBRD)South SudanSpainSri LankaSt. Kitts and NevisSt. LuciaSt. Martin (French part)St. Vincent and the GrenadinesSub-Saharan Africa Sub-Saharan Africa (excluding high income)Sub-Saharan Africa (IDA & IBRD countries)SudanSurinameSwazilandSwedenSwitzerlandSyrian Arab RepublicTajikistanTanzaniaThailandTimor-LesteTogoTongaTrinidad and TobagoTunisiaTurkeyTurkmenistanTurks and Caicos IslandsTuvaluUgandaUkraineUnited Arab EmiratesUnited KingdomUnited StatesUpper middle incomeUruguayUzbekistanVanuatuVenezuela, RBVietnamVirgin Islands (U.S.)West Bank and GazaWorldYemen, Rep.ZambiaZimbabwe línea de tiempo (timeline):
En esta escala de tiempo se presenta un gráfico de 1961 y 2016 de Syrian Arab Republic. Los datos de 1960 están ausentes. El número de observaciones reales por fecha: 56.
Fuente (nombre):
Indicadores del desarrollo mundial
Fuente (organización):
Derived from total population. Population source: (1) United Nations Population Division. World Population Prospects, (2) United Nations Statistical Division. Population and Vital Statistics Report (various years), (3) Census reports and other statistical
Categorías:
Climate Change, Health
Se ha actualizado:
23 abr 2017 año
Los indicadores de los cambios de valor en los últimos años
Mínimo:
-3.339
1 ene 2014 año
Máximo:
3.656
1 ene 2008 año
A la fecha de observación
Valor
Cambio absoluto
El cambio con respecto al valor anterior
1 ene 1961 año
3.208
+3.208
0.0%
1 ene 1962 año
3.21
+0.002
0.07%
1 ene 1963 año
3.213
+0.003
0.08%
1 ene 1964 año
3.223
+0.01
0.31%
1 ene 1965 año
3.244
+0.021
0.66%
1 ene 1966 año
3.272
+0.028
0.86%
1 ene 1967 año
3.297
+0.025
0.78%
1 ene 1968 año
3.317
+0.02
0.62%
1 ene 1969 año
3.338
+0.021
0.62%
1 ene 1970 año
3.359
+0.021
0.62%
1 ene 1971 año
3.378
+0.019
0.57%
1 ene 1972 año
3.399
+0.021
0.64%
1 ene 1973 año
3.417
+0.018
0.52%
1 ene 1974 año
3.422
+0.005
0.14%
1 ene 1975 año
3.411
-0.011
-0.31%
1 ene 1976 año
3.393
-0.019
-0.54%
1 ene 1977 año
3.362
-0.031
-0.91%
1 ene 1978 año
3.338
-0.024
-0.7%
1 ene 1979 año
3.346
+0.008
0.23%
1 ene 1980 año
3.392
+0.046
1.38%
1 ene 1981 año
3.456
+0.064
1.89%
1 ene 1982 año
3.523
+0.066
1.92%
1 ene 1983 año
3.56
+0.038
1.07%
1 ene 1984 año
3.549
-0.011
-0.32%
1 ene 1985 año
3.479
-0.07
-1.97%
1 ene 1986 año
3.373
-0.107
-3.06%
1 ene 1987 año
3.26
-0.113
-3.34%
1 ene 1988 año
3.162
-0.098
-3.0%
1 ene 1989 año
3.077
-0.085
-2.69%
1 ene 1990 año
3.01
-0.067
-2.16%
1 ene 1991 año
2.957
-0.053
-1.77%
1 ene 1992 año
2.897
-0.06
-2.02%
1 ene 1993 año
2.835
-0.062
-2.14%
1 ene 1994 año
2.793
-0.042
-1.5%
1 ene 1995 año
2.774
-0.019
-0.68%
1 ene 1996 año
2.766
-0.008
-0.3%
1 ene 1997 año
2.782
+0.016
0.58%
1 ene 1998 año
2.782
+0.001
0.02%
1 ene 1999 año
2.714
-0.068
-2.46%
1 ene 2000 año
2.56
-0.154
-5.69%
1 ene 2001 año
2.361
-0.198
-7.75%
1 ene 2002 año
2.06
-0.301
-12.76%
1 ene 2003 año
1.799
-0.261
-12.65%
1 ene 2004 año
1.789
-0.01
-0.58%
1 ene 2005 año
2.102
+0.313
17.49%
1 ene 2006 año
2.575
+0.473
22.5%
1 ene 2007 año
3.231
+0.656
25.47%
1 ene 2008 año
3.656
+0.426
13.17%
1 ene 2009 año
3.398
-0.258
-7.06%
1 ene 2010 año
2.311
-1.087
-32.0%
1 ene 2011 año
0.745
-1.566
-67.77%
1 ene 2012 año
-1.065
-1.809
-242.97%
1 ene 2013 año
-2.581
-1.517
142.45%
1 ene 2014 año
-3.339
-0.758
29.37%
1 ene 2015 año
-2.888
+0.451
-13.51%
1 ene 2016 año
-1.449
+1.439
-49.83%
Ranking de los países por los datos estadísticos actuales


Comentarios: