29
/es/
es
AIzaSyAYiBZKx7MnpbEhh9jyipgxe19OcubqV5w
April 1, 2024
275137
United Arab Emirates
ARE
true
2
1
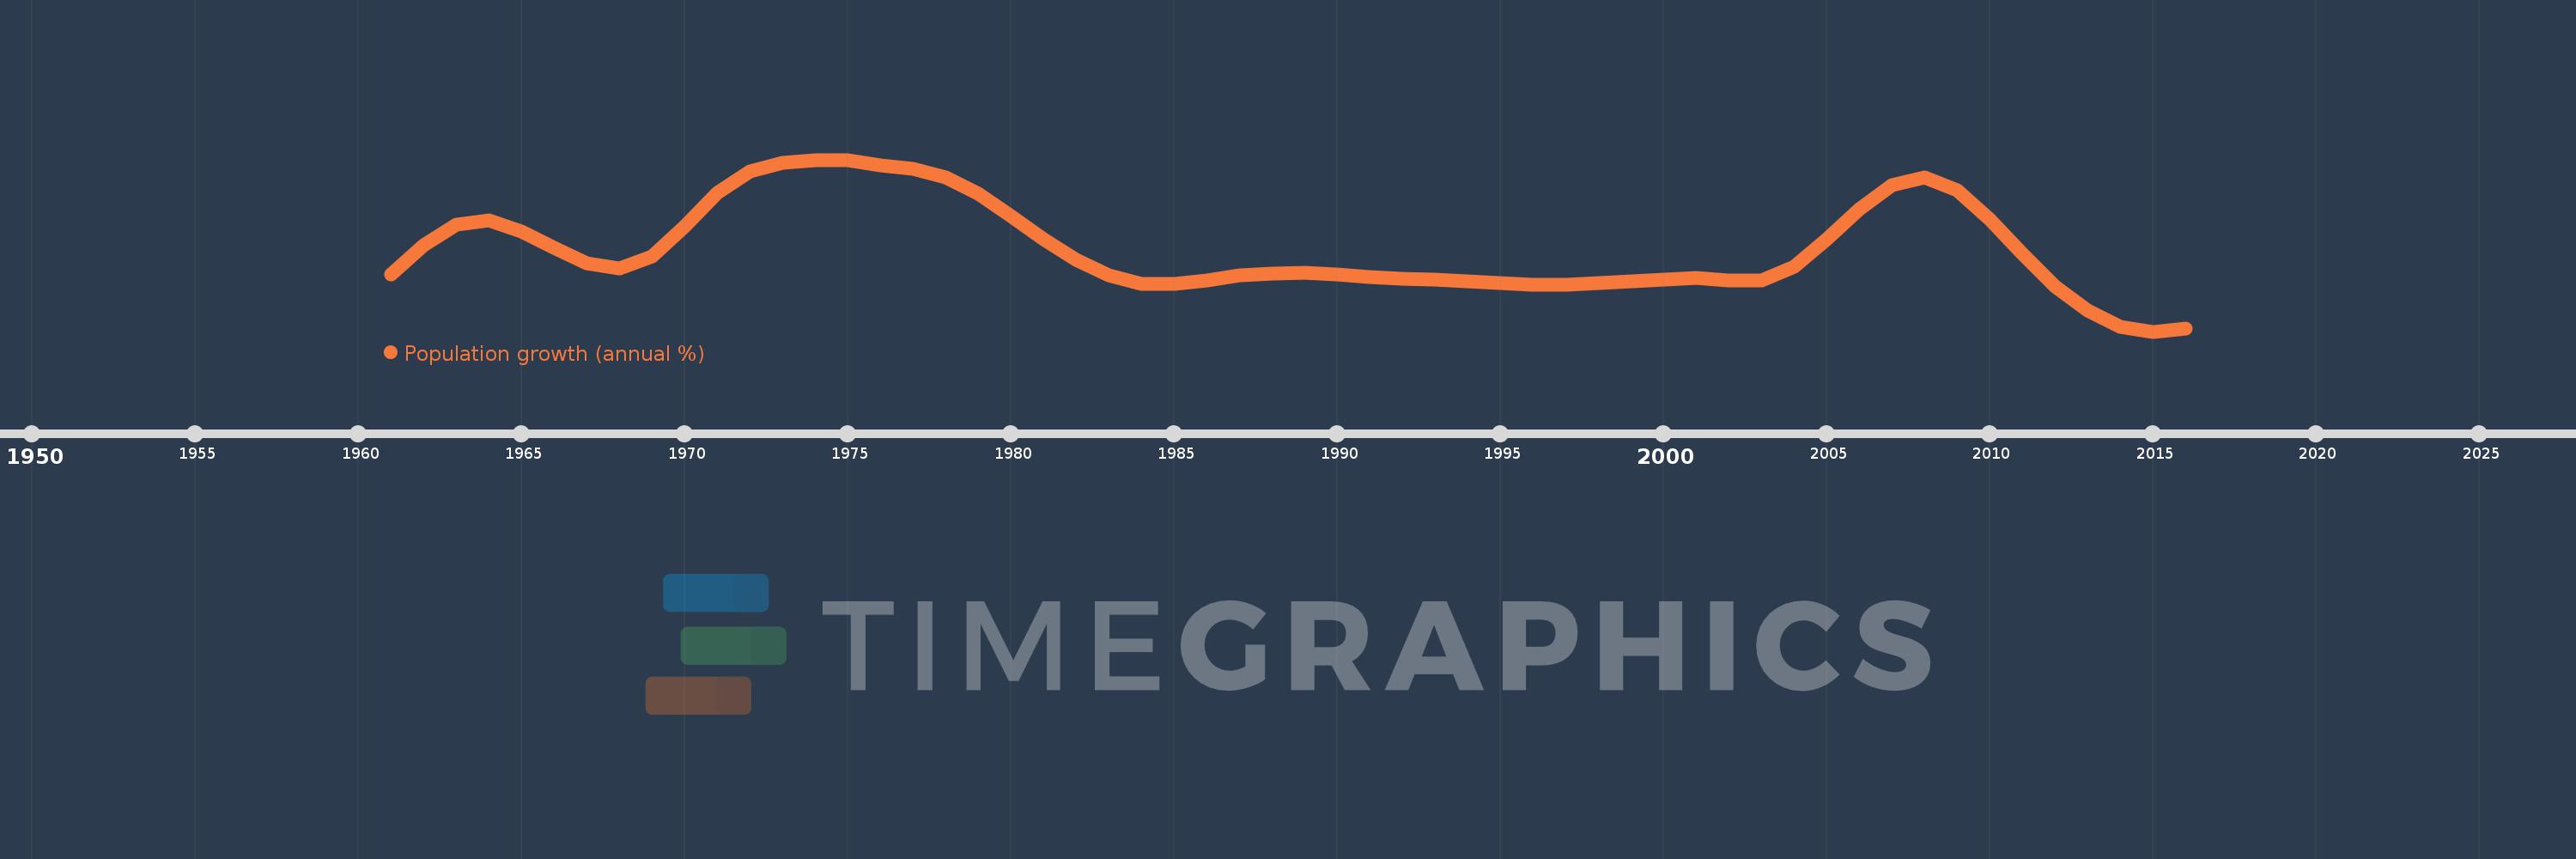
Population growth (annual %)
2016,2015,2014,2013,2012,2011,2010,2009,2008,2007,2006,2005,2004,2003,2002,2001,2000,1999,1998,1997,1996,1995,1994,1993,1992,1991,1990,1989,1988,1987,1986,1985,1984,1983,1982,1981,1980,1979,1978,1977,1976,1975,1974,1973,1972,1971,1970,1969,1968,1967,1966,1965,1964,1963,1962,1961
Estas estadísticas en otros países:
AfghanistanAlbaniaAlgeriaAmerican SamoaAndorraAngolaAntigua and BarbudaArab WorldArgentinaArmeniaArubaAustraliaAustriaAzerbaijanBahamas, TheBahrainBangladeshBarbadosBelarusBelgiumBelizeBeninBermudaBhutanBoliviaBosnia and HerzegovinaBotswanaBrazilBritish Virgin IslandsBrunei DarussalamBulgariaBurkina FasoBurundiCabo VerdeCambodiaCameroonCanadaCaribbean small statesCayman IslandsCentral African RepublicCentral Europe and the BalticsChadChannel IslandsChileChinaColombiaComorosCongo, Dem. Rep.Congo, Rep.Costa RicaCote d'IvoireCroatiaCubaCuracaoCyprusCzech RepublicDenmarkDjiboutiDominicaDominican RepublicEarly-demographic dividendEast Asia & PacificEast Asia & Pacific (excluding high income)East Asia & Pacific (IDA & IBRD countries)EcuadorEgypt, Arab Rep.El SalvadorEquatorial GuineaEritreaEstoniaEthiopiaEuro areaEurope & Central AsiaEurope & Central Asia (excluding high income)Europe & Central Asia (IDA & IBRD countries)European UnionFaroe IslandsFijiFinlandFragile and conflict affected situationsFranceFrench PolynesiaGabonGambia, TheGeorgiaGermanyGhanaGibraltarGreeceGreenlandGrenadaGuamGuatemalaGuineaGuinea-BissauGuyanaHaitiHeavily indebted poor countries (HIPC)High incomeHondurasHong Kong SAR, ChinaHungaryIBRD onlyIcelandIDA & IBRD totalIDA blendIDA onlyIDA totalIndiaIndonesiaIran, Islamic Rep.IraqIrelandIsle of ManIsraelItalyJamaicaJapanJordanKazakhstanKenyaKiribatiKorea, Dem. People’s Rep.Korea, Rep.KosovoKuwaitKyrgyz RepublicLao PDRLate-demographic dividendLatin America & Caribbean Latin America & Caribbean (excluding high income)Latin America & the Caribbean (IDA & IBRD countries)LatviaLeast developed countries: UN classificationLebanonLesothoLiberiaLibyaLiechtensteinLithuaniaLow & middle incomeLow incomeLower middle incomeLuxembourgMacao SAR, ChinaMacedonia, FYRMadagascarMalawiMalaysiaMaldivesMaliMaltaMarshall IslandsMauritaniaMauritiusMexicoMicronesia, Fed. Sts.Middle East & North AfricaMiddle East & North Africa (excluding high income)Middle East & North Africa (IDA & IBRD countries)Middle incomeMoldovaMonacoMongoliaMontenegroMoroccoMozambiqueMyanmarNamibiaNauruNepalNetherlandsNew CaledoniaNew ZealandNicaraguaNigerNigeriaNorth AmericaNorthern Mariana IslandsNorwayOECD membersOmanOther small statesPacific island small statesPakistanPalauPanamaPapua New GuineaParaguayPeruPhilippinesPolandPortugalPost-demographic dividendPre-demographic dividendPuerto RicoQatarRomaniaRussian FederationRwandaSamoaSan MarinoSao Tome and PrincipeSaudi ArabiaSenegalSerbiaSeychellesSierra LeoneSingaporeSint Maarten (Dutch part)Slovak RepublicSloveniaSmall statesSolomon IslandsSomaliaSouth AfricaSouth AsiaSouth Asia (IDA & IBRD)South SudanSpainSri LankaSt. Kitts and NevisSt. LuciaSt. Martin (French part)St. Vincent and the GrenadinesSub-Saharan Africa Sub-Saharan Africa (excluding high income)Sub-Saharan Africa (IDA & IBRD countries)SudanSurinameSwazilandSwedenSwitzerlandSyrian Arab RepublicTajikistanTanzaniaThailandTimor-LesteTogoTongaTrinidad and TobagoTunisiaTurkeyTurkmenistanTurks and Caicos IslandsTuvaluUgandaUkraineUnited Arab EmiratesUnited KingdomUnited StatesUpper middle incomeUruguayUzbekistanVanuatuVenezuela, RBVietnamVirgin Islands (U.S.)West Bank and GazaWorldYemen, Rep.ZambiaZimbabwe línea de tiempo (timeline):
En esta escala de tiempo se presenta un gráfico de 1961 y 2016 de United Arab Emirates. Los datos de 1960 están ausentes. El número de observaciones reales por fecha: 56.
Fuente (nombre):
Indicadores del desarrollo mundial
Fuente (organización):
Derived from total population. Population source: (1) United Nations Population Division. World Population Prospects, (2) United Nations Statistical Division. Population and Vital Statistics Report (various years), (3) Census reports and other statistical
Categorías:
Climate Change, Health
Se ha actualizado:
23 abr 2017 año
Los indicadores de los cambios de valor en los últimos años
Mínimo:
0.509
1 ene 2015 año
Máximo:
16.662
1 ene 1974 año
A la fecha de observación
Valor
Cambio absoluto
El cambio con respecto al valor anterior
1 ene 1961 año
5.903
+5.903
0.0%
1 ene 1962 año
8.655
+2.752
46.62%
1 ene 1963 año
10.567
+1.911
22.08%
1 ene 1964 año
10.94
+0.373
3.53%
1 ene 1965 año
9.881
-1.059
-9.68%
1 ene 1966 año
8.391
-1.49
-15.08%
1 ene 1967 año
6.913
-1.478
-17.61%
1 ene 1968 año
6.434
-0.479
-6.93%
1 ene 1969 año
7.582
+1.148
17.85%
1 ene 1970 año
10.375
+2.793
36.83%
1 ene 1971 año
13.564
+3.19
30.75%
1 ene 1972 año
15.592
+2.028
14.95%
1 ene 1973 año
16.36
+0.768
4.93%
1 ene 1974 año
16.662
+0.301
1.84%
1 ene 1975 año
16.599
-0.062
-0.37%
1 ene 1976 año
16.169
-0.43
-2.59%
1 ene 1977 año
15.776
-0.393
-2.43%
1 ene 1978 año
15.018
-0.758
-4.81%
1 ene 1979 año
13.508
-1.51
-10.05%
1 ene 1980 año
11.4
-2.108
-15.61%
1 ene 1981 año
9.212
-2.187
-19.19%
1 ene 1982 año
7.238
-1.975
-21.44%
1 ene 1983 año
5.808
-1.429
-19.75%
1 ene 1984 año
5.029
-0.779
-13.42%
1 ene 1985 año
4.968
-0.06
-1.2%
1 ene 1986 año
5.335
+0.366
7.37%
1 ene 1987 año
5.763
+0.428
8.03%
1 ene 1988 año
5.999
+0.236
4.09%
1 ene 1989 año
6.061
+0.062
1.04%
1 ene 1990 año
5.907
-0.154
-2.53%
1 ene 1991 año
5.64
-0.267
-4.52%
1 ene 1992 año
5.464
-0.176
-3.12%
1 ene 1993 año
5.384
-0.08
-1.47%
1 ene 1994 año
5.251
-0.133
-2.47%
1 ene 1995 año
5.059
-0.192
-3.65%
1 ene 1996 año
4.879
-0.18
-3.56%
1 ene 1997 año
4.88
+0.001
0.02%
1 ene 1998 año
5.037
+0.157
3.23%
1 ene 1999 año
5.201
+0.164
3.25%
1 ene 2000 año
5.356
+0.155
2.98%
1 ene 2001 año
5.594
+0.238
4.44%
1 ene 2002 año
5.353
-0.241
-4.3%
1 ene 2003 año
5.331
-0.023
-0.42%
1 ene 2004 año
6.605
+1.274
23.9%
1 ene 2005 año
9.219
+2.614
39.58%
1 ene 2006 año
11.98
+2.761
29.95%
1 ene 2007 año
14.305
+2.325
19.41%
1 ene 2008 año
15.033
+0.727
5.09%
1 ene 2009 año
13.81
-1.223
-8.13%
1 ene 2010 año
11.038
-2.772
-20.07%
1 ene 2011 año
7.787
-3.251
-29.45%
1 ene 2012 año
4.751
-3.037
-38.99%
1 ene 2013 año
2.463
-2.288
-48.15%
1 ene 2014 año
0.972
-1.491
-60.54%
1 ene 2015 año
0.509
-0.463
-47.6%
1 ene 2016 año
0.776
+0.267
52.44%
Ranking de los países por los datos estadísticos actuales


Comentarios: