29
/es/
es
AIzaSyAYiBZKx7MnpbEhh9jyipgxe19OcubqV5w
April 1, 2024
260070
Tajikistan
TJK
true
2
1
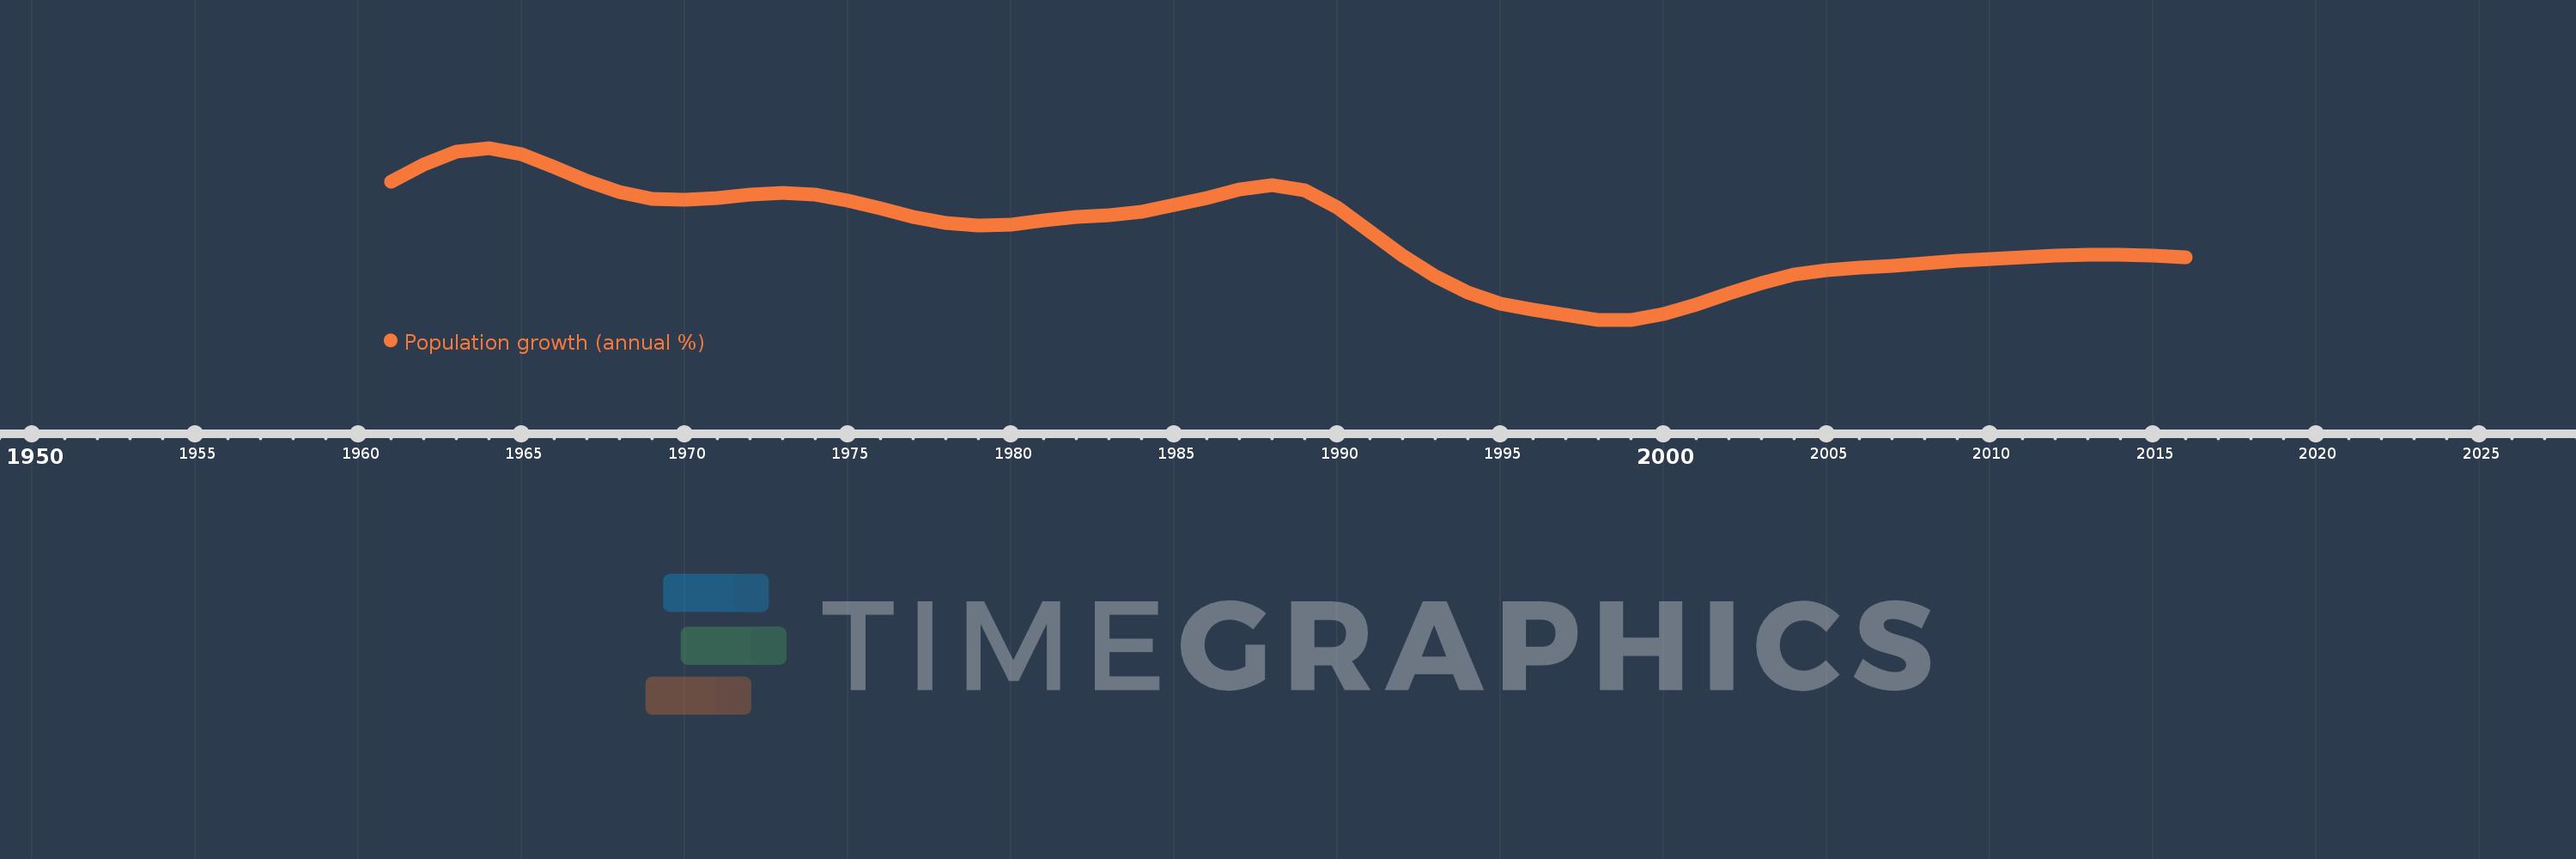
Population growth (annual %)
2016,2015,2014,2013,2012,2011,2010,2009,2008,2007,2006,2005,2004,2003,2002,2001,2000,1999,1998,1997,1996,1995,1994,1993,1992,1991,1990,1989,1988,1987,1986,1985,1984,1983,1982,1981,1980,1979,1978,1977,1976,1975,1974,1973,1972,1971,1970,1969,1968,1967,1966,1965,1964,1963,1962,1961
Estas estadísticas en otros países:
AfghanistanAlbaniaAlgeriaAmerican SamoaAndorraAngolaAntigua and BarbudaArab WorldArgentinaArmeniaArubaAustraliaAustriaAzerbaijanBahamas, TheBahrainBangladeshBarbadosBelarusBelgiumBelizeBeninBermudaBhutanBoliviaBosnia and HerzegovinaBotswanaBrazilBritish Virgin IslandsBrunei DarussalamBulgariaBurkina FasoBurundiCabo VerdeCambodiaCameroonCanadaCaribbean small statesCayman IslandsCentral African RepublicCentral Europe and the BalticsChadChannel IslandsChileChinaColombiaComorosCongo, Dem. Rep.Congo, Rep.Costa RicaCote d'IvoireCroatiaCubaCuracaoCyprusCzech RepublicDenmarkDjiboutiDominicaDominican RepublicEarly-demographic dividendEast Asia & PacificEast Asia & Pacific (excluding high income)East Asia & Pacific (IDA & IBRD countries)EcuadorEgypt, Arab Rep.El SalvadorEquatorial GuineaEritreaEstoniaEthiopiaEuro areaEurope & Central AsiaEurope & Central Asia (excluding high income)Europe & Central Asia (IDA & IBRD countries)European UnionFaroe IslandsFijiFinlandFragile and conflict affected situationsFranceFrench PolynesiaGabonGambia, TheGeorgiaGermanyGhanaGibraltarGreeceGreenlandGrenadaGuamGuatemalaGuineaGuinea-BissauGuyanaHaitiHeavily indebted poor countries (HIPC)High incomeHondurasHong Kong SAR, ChinaHungaryIBRD onlyIcelandIDA & IBRD totalIDA blendIDA onlyIDA totalIndiaIndonesiaIran, Islamic Rep.IraqIrelandIsle of ManIsraelItalyJamaicaJapanJordanKazakhstanKenyaKiribatiKorea, Dem. People’s Rep.Korea, Rep.KosovoKuwaitKyrgyz RepublicLao PDRLate-demographic dividendLatin America & Caribbean Latin America & Caribbean (excluding high income)Latin America & the Caribbean (IDA & IBRD countries)LatviaLeast developed countries: UN classificationLebanonLesothoLiberiaLibyaLiechtensteinLithuaniaLow & middle incomeLow incomeLower middle incomeLuxembourgMacao SAR, ChinaMacedonia, FYRMadagascarMalawiMalaysiaMaldivesMaliMaltaMarshall IslandsMauritaniaMauritiusMexicoMicronesia, Fed. Sts.Middle East & North AfricaMiddle East & North Africa (excluding high income)Middle East & North Africa (IDA & IBRD countries)Middle incomeMoldovaMonacoMongoliaMontenegroMoroccoMozambiqueMyanmarNamibiaNauruNepalNetherlandsNew CaledoniaNew ZealandNicaraguaNigerNigeriaNorth AmericaNorthern Mariana IslandsNorwayOECD membersOmanOther small statesPacific island small statesPakistanPalauPanamaPapua New GuineaParaguayPeruPhilippinesPolandPortugalPost-demographic dividendPre-demographic dividendPuerto RicoQatarRomaniaRussian FederationRwandaSamoaSan MarinoSao Tome and PrincipeSaudi ArabiaSenegalSerbiaSeychellesSierra LeoneSingaporeSint Maarten (Dutch part)Slovak RepublicSloveniaSmall statesSolomon IslandsSomaliaSouth AfricaSouth AsiaSouth Asia (IDA & IBRD)South SudanSpainSri LankaSt. Kitts and NevisSt. LuciaSt. Martin (French part)St. Vincent and the GrenadinesSub-Saharan Africa Sub-Saharan Africa (excluding high income)Sub-Saharan Africa (IDA & IBRD countries)SudanSurinameSwazilandSwedenSwitzerlandSyrian Arab RepublicTajikistanTanzaniaThailandTimor-LesteTogoTongaTrinidad and TobagoTunisiaTurkeyTurkmenistanTurks and Caicos IslandsTuvaluUgandaUkraineUnited Arab EmiratesUnited KingdomUnited StatesUpper middle incomeUruguayUzbekistanVanuatuVenezuela, RBVietnamVirgin Islands (U.S.)West Bank and GazaWorldYemen, Rep.ZambiaZimbabwe línea de tiempo (timeline):
En esta escala de tiempo se presenta un gráfico de 1961 y 2016 de Tajikistan. Los datos de 1960 están ausentes. El número de observaciones reales por fecha: 56.
Fuente (nombre):
Indicadores del desarrollo mundial
Fuente (organización):
Derived from total population. Population source: (1) United Nations Population Division. World Population Prospects, (2) United Nations Statistical Division. Population and Vital Statistics Report (various years), (3) Census reports and other statistical
Categorías:
Climate Change, Health
Se ha actualizado:
23 abr 2017 año
Los indicadores de los cambios de valor en los últimos años
Mínimo:
1.264
1 ene 1998 año
Máximo:
3.891
1 ene 1964 año
A la fecha de observación
Valor
Cambio absoluto
El cambio con respecto al valor anterior
1 ene 1961 año
3.375
+3.375
0.0%
1 ene 1962 año
3.634
+0.259
7.67%
1 ene 1963 año
3.829
+0.195
5.37%
1 ene 1964 año
3.891
+0.062
1.62%
1 ene 1965 año
3.794
-0.097
-2.5%
1 ene 1966 año
3.601
-0.193
-5.09%
1 ene 1967 año
3.384
-0.217
-6.02%
1 ene 1968 año
3.214
-0.17
-5.02%
1 ene 1969 año
3.11
-0.104
-3.24%
1 ene 1970 año
3.093
-0.017
-0.55%
1 ene 1971 año
3.129
+0.036
1.17%
1 ene 1972 año
3.181
+0.052
1.66%
1 ene 1973 año
3.203
+0.021
0.67%
1 ene 1974 año
3.175
-0.027
-0.85%
1 ene 1975 año
3.086
-0.089
-2.8%
1 ene 1976 año
2.964
-0.122
-3.97%
1 ene 1977 año
2.838
-0.126
-4.27%
1 ene 1978 año
2.745
-0.093
-3.27%
1 ene 1979 año
2.703
-0.042
-1.54%
1 ene 1980 año
2.724
+0.021
0.77%
1 ene 1981 año
2.786
+0.063
2.3%
1 ene 1982 año
2.83
+0.044
1.58%
1 ene 1983 año
2.857
+0.027
0.96%
1 ene 1984 año
2.919
+0.062
2.17%
1 ene 1985 año
3.021
+0.102
3.49%
1 ene 1986 año
3.131
+0.109
3.62%
1 ene 1987 año
3.255
+0.124
3.97%
1 ene 1988 año
3.32
+0.065
1.99%
1 ene 1989 año
3.238
-0.082
-2.47%
1 ene 1990 año
2.981
-0.257
-7.94%
1 ene 1991 año
2.619
-0.362
-12.15%
1 ene 1992 año
2.245
-0.374
-14.27%
1 ene 1993 año
1.931
-0.314
-13.97%
1 ene 1994 año
1.68
-0.251
-13.0%
1 ene 1995 año
1.516
-0.164
-9.76%
1 ene 1996 año
1.423
-0.093
-6.16%
1 ene 1997 año
1.338
-0.085
-5.99%
1 ene 1998 año
1.264
-0.074
-5.52%
1 ene 1999 año
1.264
+0.0
0.03%
1 ene 2000 año
1.352
+0.087
6.92%
1 ene 2001 año
1.499
+0.147
10.88%
1 ene 2002 año
1.671
+0.173
11.51%
1 ene 2003 año
1.829
+0.158
9.43%
1 ene 2004 año
1.953
+0.124
6.79%
1 ene 2005 año
2.027
+0.074
3.77%
1 ene 2006 año
2.064
+0.037
1.84%
1 ene 2007 año
2.093
+0.029
1.38%
1 ene 2008 año
2.128
+0.035
1.68%
1 ene 2009 año
2.161
+0.033
1.54%
1 ene 2010 año
2.194
+0.033
1.53%
1 ene 2011 año
2.224
+0.03
1.37%
1 ene 2012 año
2.246
+0.022
1.01%
1 ene 2013 año
2.257
+0.011
0.48%
1 ene 2014 año
2.256
-0.001
-0.04%
1 ene 2015 año
2.242
-0.014
-0.61%
1 ene 2016 año
2.217
-0.025
-1.11%
Ranking de los países por los datos estadísticos actuales


Comentarios: