29
/es/
es
AIzaSyAYiBZKx7MnpbEhh9jyipgxe19OcubqV5w
April 1, 2024
108928
Comoros
COM
true
2
1
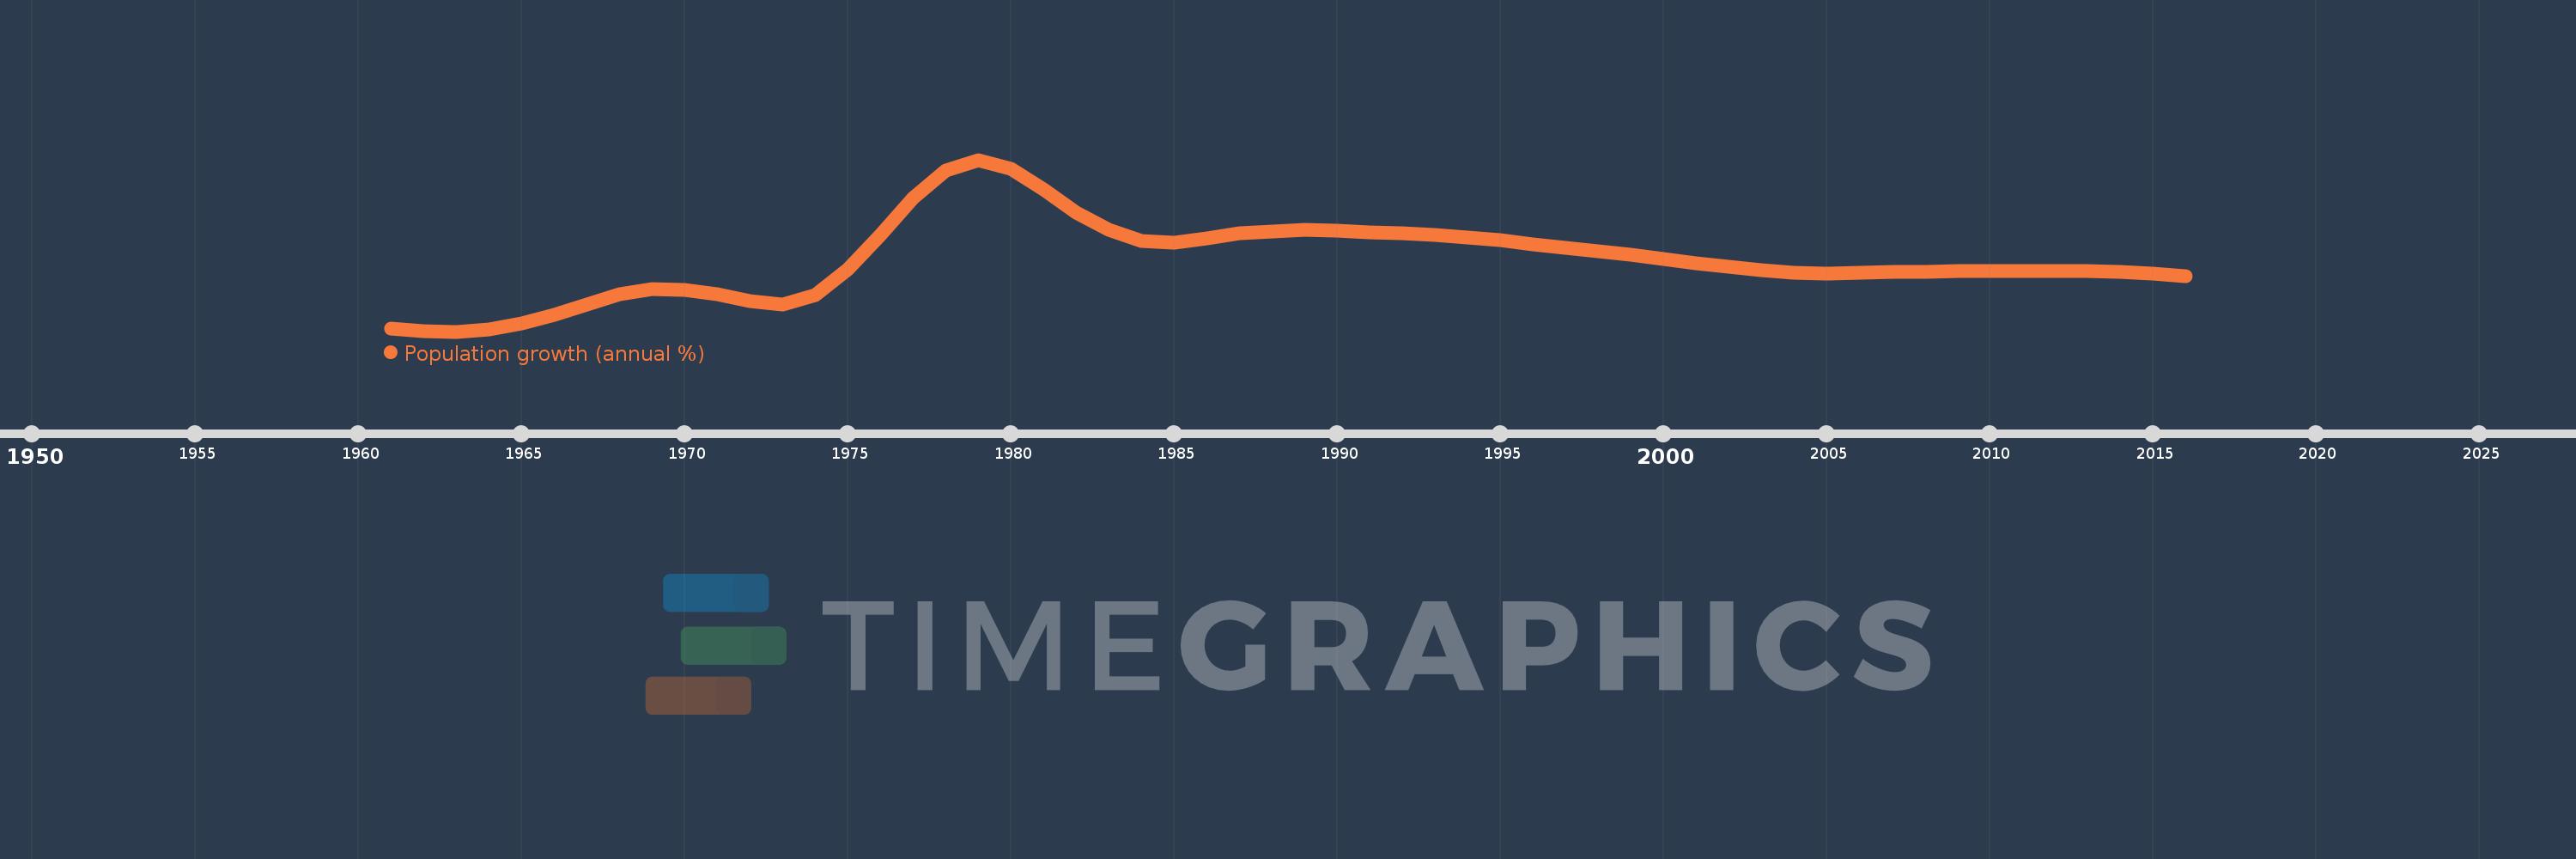
Population growth (annual %)
2016,2015,2014,2013,2012,2011,2010,2009,2008,2007,2006,2005,2004,2003,2002,2001,2000,1999,1998,1997,1996,1995,1994,1993,1992,1991,1990,1989,1988,1987,1986,1985,1984,1983,1982,1981,1980,1979,1978,1977,1976,1975,1974,1973,1972,1971,1970,1969,1968,1967,1966,1965,1964,1963,1962,1961
Estas estadísticas en otros países:
AfghanistanAlbaniaAlgeriaAmerican SamoaAndorraAngolaAntigua and BarbudaArab WorldArgentinaArmeniaArubaAustraliaAustriaAzerbaijanBahamas, TheBahrainBangladeshBarbadosBelarusBelgiumBelizeBeninBermudaBhutanBoliviaBosnia and HerzegovinaBotswanaBrazilBritish Virgin IslandsBrunei DarussalamBulgariaBurkina FasoBurundiCabo VerdeCambodiaCameroonCanadaCaribbean small statesCayman IslandsCentral African RepublicCentral Europe and the BalticsChadChannel IslandsChileChinaColombiaComorosCongo, Dem. Rep.Congo, Rep.Costa RicaCote d'IvoireCroatiaCubaCuracaoCyprusCzech RepublicDenmarkDjiboutiDominicaDominican RepublicEarly-demographic dividendEast Asia & PacificEast Asia & Pacific (excluding high income)East Asia & Pacific (IDA & IBRD countries)EcuadorEgypt, Arab Rep.El SalvadorEquatorial GuineaEritreaEstoniaEthiopiaEuro areaEurope & Central AsiaEurope & Central Asia (excluding high income)Europe & Central Asia (IDA & IBRD countries)European UnionFaroe IslandsFijiFinlandFragile and conflict affected situationsFranceFrench PolynesiaGabonGambia, TheGeorgiaGermanyGhanaGibraltarGreeceGreenlandGrenadaGuamGuatemalaGuineaGuinea-BissauGuyanaHaitiHeavily indebted poor countries (HIPC)High incomeHondurasHong Kong SAR, ChinaHungaryIBRD onlyIcelandIDA & IBRD totalIDA blendIDA onlyIDA totalIndiaIndonesiaIran, Islamic Rep.IraqIrelandIsle of ManIsraelItalyJamaicaJapanJordanKazakhstanKenyaKiribatiKorea, Dem. People’s Rep.Korea, Rep.KosovoKuwaitKyrgyz RepublicLao PDRLate-demographic dividendLatin America & Caribbean Latin America & Caribbean (excluding high income)Latin America & the Caribbean (IDA & IBRD countries)LatviaLeast developed countries: UN classificationLebanonLesothoLiberiaLibyaLiechtensteinLithuaniaLow & middle incomeLow incomeLower middle incomeLuxembourgMacao SAR, ChinaMacedonia, FYRMadagascarMalawiMalaysiaMaldivesMaliMaltaMarshall IslandsMauritaniaMauritiusMexicoMicronesia, Fed. Sts.Middle East & North AfricaMiddle East & North Africa (excluding high income)Middle East & North Africa (IDA & IBRD countries)Middle incomeMoldovaMonacoMongoliaMontenegroMoroccoMozambiqueMyanmarNamibiaNauruNepalNetherlandsNew CaledoniaNew ZealandNicaraguaNigerNigeriaNorth AmericaNorthern Mariana IslandsNorwayOECD membersOmanOther small statesPacific island small statesPakistanPalauPanamaPapua New GuineaParaguayPeruPhilippinesPolandPortugalPost-demographic dividendPre-demographic dividendPuerto RicoQatarRomaniaRussian FederationRwandaSamoaSan MarinoSao Tome and PrincipeSaudi ArabiaSenegalSerbiaSeychellesSierra LeoneSingaporeSint Maarten (Dutch part)Slovak RepublicSloveniaSmall statesSolomon IslandsSomaliaSouth AfricaSouth AsiaSouth Asia (IDA & IBRD)South SudanSpainSri LankaSt. Kitts and NevisSt. LuciaSt. Martin (French part)St. Vincent and the GrenadinesSub-Saharan Africa Sub-Saharan Africa (excluding high income)Sub-Saharan Africa (IDA & IBRD countries)SudanSurinameSwazilandSwedenSwitzerlandSyrian Arab RepublicTajikistanTanzaniaThailandTimor-LesteTogoTongaTrinidad and TobagoTunisiaTurkeyTurkmenistanTurks and Caicos IslandsTuvaluUgandaUkraineUnited Arab EmiratesUnited KingdomUnited StatesUpper middle incomeUruguayUzbekistanVanuatuVenezuela, RBVietnamVirgin Islands (U.S.)West Bank and GazaWorldYemen, Rep.ZambiaZimbabwe línea de tiempo (timeline):
En esta escala de tiempo se presenta un gráfico de 1961 y 2016 de Comoros. Los datos de 1960 están ausentes. El número de observaciones reales por fecha: 56.
Fuente (nombre):
Indicadores del desarrollo mundial
Fuente (organización):
Derived from total population. Population source: (1) United Nations Population Division. World Population Prospects, (2) United Nations Statistical Division. Population and Vital Statistics Report (various years), (3) Census reports and other statistical
Categorías:
Climate Change, Health
Se ha actualizado:
23 abr 2017 año
Los indicadores de los cambios de valor en los últimos años
Mínimo:
1.62
1 ene 1963 año
Máximo:
3.946
1 ene 1979 año
A la fecha de observación
Valor
Cambio absoluto
El cambio con respecto al valor anterior
1 ene 1961 año
1.658
+1.658
0.0%
1 ene 1962 año
1.627
-0.031
-1.85%
1 ene 1963 año
1.62
-0.008
-0.47%
1 ene 1964 año
1.651
+0.031
1.93%
1 ene 1965 año
1.731
+0.08
4.84%
1 ene 1966 año
1.841
+0.11
6.38%
1 ene 1967 año
1.988
+0.147
7.97%
1 ene 1968 año
2.126
+0.138
6.94%
1 ene 1969 año
2.198
+0.072
3.38%
1 ene 1970 año
2.186
-0.012
-0.54%
1 ene 1971 año
2.13
-0.056
-2.56%
1 ene 1972 año
2.029
-0.101
-4.74%
1 ene 1973 año
1.984
-0.045
-2.2%
1 ene 1974 año
2.113
+0.129
6.49%
1 ene 1975 año
2.459
+0.346
16.37%
1 ene 1976 año
2.925
+0.466
18.95%
1 ene 1977 año
3.423
+0.498
17.03%
1 ene 1978 año
3.796
+0.373
10.9%
1 ene 1979 año
3.946
+0.149
3.94%
1 ene 1980 año
3.828
-0.118
-2.99%
1 ene 1981 año
3.548
-0.28
-7.32%
1 ene 1982 año
3.234
-0.313
-8.83%
1 ene 1983 año
2.997
-0.237
-7.32%
1 ene 1984 año
2.852
-0.146
-4.87%
1 ene 1985 año
2.829
-0.022
-0.78%
1 ene 1986 año
2.887
+0.058
2.05%
1 ene 1987 año
2.951
+0.064
2.21%
1 ene 1988 año
2.98
+0.029
0.99%
1 ene 1989 año
2.996
+0.016
0.52%
1 ene 1990 año
2.99
-0.006
-0.21%
1 ene 1991 año
2.968
-0.021
-0.72%
1 ene 1992 año
2.946
-0.022
-0.75%
1 ene 1993 año
2.926
-0.02
-0.67%
1 ene 1994 año
2.896
-0.03
-1.03%
1 ene 1995 año
2.854
-0.042
-1.44%
1 ene 1996 año
2.805
-0.049
-1.72%
1 ene 1997 año
2.757
-0.048
-1.72%
1 ene 1998 año
2.711
-0.046
-1.67%
1 ene 1999 año
2.66
-0.051
-1.87%
1 ene 2000 año
2.605
-0.055
-2.07%
1 ene 2001 año
2.549
-0.056
-2.13%
1 ene 2002 año
2.494
-0.056
-2.19%
1 ene 2003 año
2.446
-0.048
-1.92%
1 ene 2004 año
2.416
-0.03
-1.22%
1 ene 2005 año
2.408
-0.008
-0.32%
1 ene 2006 año
2.415
+0.007
0.29%
1 ene 2007 año
2.424
+0.009
0.38%
1 ene 2008 año
2.43
+0.005
0.22%
1 ene 2009 año
2.435
+0.005
0.23%
1 ene 2010 año
2.439
+0.004
0.16%
1 ene 2011 año
2.441
+0.002
0.08%
1 ene 2012 año
2.443
+0.001
0.06%
1 ene 2013 año
2.441
-0.002
-0.08%
1 ene 2014 año
2.429
-0.012
-0.49%
1 ene 2015 año
2.405
-0.024
-0.99%
1 ene 2016 año
2.372
-0.032
-1.35%
Ranking de los países por los datos estadísticos actuales


Comentarios: