29
/es/
es
AIzaSyAYiBZKx7MnpbEhh9jyipgxe19OcubqV5w
April 1, 2024
274090
Ukraine
UKR
true
2
1
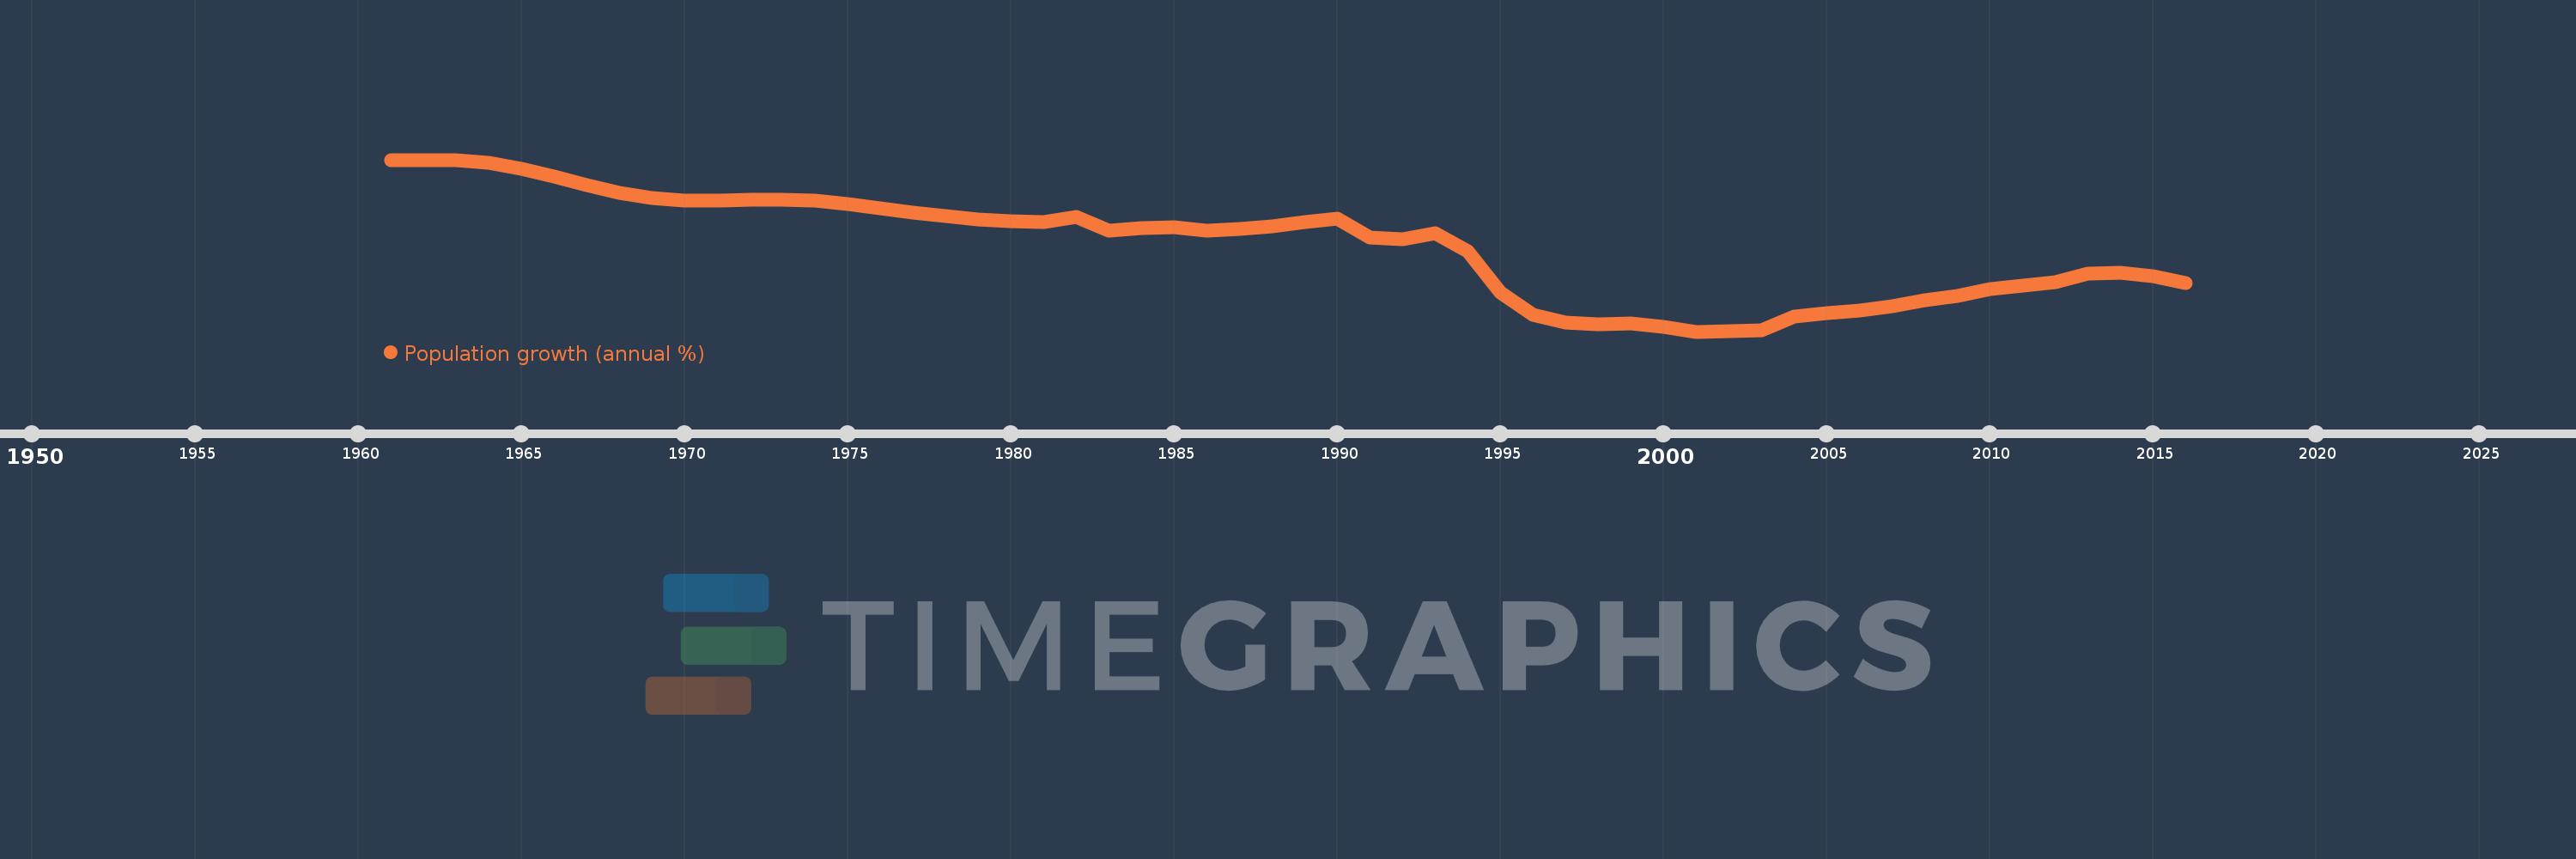
Population growth (annual %)
2016,2015,2014,2013,2012,2011,2010,2009,2008,2007,2006,2005,2004,2003,2002,2001,2000,1999,1998,1997,1996,1995,1994,1993,1992,1991,1990,1989,1988,1987,1986,1985,1984,1983,1982,1981,1980,1979,1978,1977,1976,1975,1974,1973,1972,1971,1970,1969,1968,1967,1966,1965,1964,1963,1962,1961
Estas estadísticas en otros países:
AfghanistanAlbaniaAlgeriaAmerican SamoaAndorraAngolaAntigua and BarbudaArab WorldArgentinaArmeniaArubaAustraliaAustriaAzerbaijanBahamas, TheBahrainBangladeshBarbadosBelarusBelgiumBelizeBeninBermudaBhutanBoliviaBosnia and HerzegovinaBotswanaBrazilBritish Virgin IslandsBrunei DarussalamBulgariaBurkina FasoBurundiCabo VerdeCambodiaCameroonCanadaCaribbean small statesCayman IslandsCentral African RepublicCentral Europe and the BalticsChadChannel IslandsChileChinaColombiaComorosCongo, Dem. Rep.Congo, Rep.Costa RicaCote d'IvoireCroatiaCubaCuracaoCyprusCzech RepublicDenmarkDjiboutiDominicaDominican RepublicEarly-demographic dividendEast Asia & PacificEast Asia & Pacific (excluding high income)East Asia & Pacific (IDA & IBRD countries)EcuadorEgypt, Arab Rep.El SalvadorEquatorial GuineaEritreaEstoniaEthiopiaEuro areaEurope & Central AsiaEurope & Central Asia (excluding high income)Europe & Central Asia (IDA & IBRD countries)European UnionFaroe IslandsFijiFinlandFragile and conflict affected situationsFranceFrench PolynesiaGabonGambia, TheGeorgiaGermanyGhanaGibraltarGreeceGreenlandGrenadaGuamGuatemalaGuineaGuinea-BissauGuyanaHaitiHeavily indebted poor countries (HIPC)High incomeHondurasHong Kong SAR, ChinaHungaryIBRD onlyIcelandIDA & IBRD totalIDA blendIDA onlyIDA totalIndiaIndonesiaIran, Islamic Rep.IraqIrelandIsle of ManIsraelItalyJamaicaJapanJordanKazakhstanKenyaKiribatiKorea, Dem. People’s Rep.Korea, Rep.KosovoKuwaitKyrgyz RepublicLao PDRLate-demographic dividendLatin America & Caribbean Latin America & Caribbean (excluding high income)Latin America & the Caribbean (IDA & IBRD countries)LatviaLeast developed countries: UN classificationLebanonLesothoLiberiaLibyaLiechtensteinLithuaniaLow & middle incomeLow incomeLower middle incomeLuxembourgMacao SAR, ChinaMacedonia, FYRMadagascarMalawiMalaysiaMaldivesMaliMaltaMarshall IslandsMauritaniaMauritiusMexicoMicronesia, Fed. Sts.Middle East & North AfricaMiddle East & North Africa (excluding high income)Middle East & North Africa (IDA & IBRD countries)Middle incomeMoldovaMonacoMongoliaMontenegroMoroccoMozambiqueMyanmarNamibiaNauruNepalNetherlandsNew CaledoniaNew ZealandNicaraguaNigerNigeriaNorth AmericaNorthern Mariana IslandsNorwayOECD membersOmanOther small statesPacific island small statesPakistanPalauPanamaPapua New GuineaParaguayPeruPhilippinesPolandPortugalPost-demographic dividendPre-demographic dividendPuerto RicoQatarRomaniaRussian FederationRwandaSamoaSan MarinoSao Tome and PrincipeSaudi ArabiaSenegalSerbiaSeychellesSierra LeoneSingaporeSint Maarten (Dutch part)Slovak RepublicSloveniaSmall statesSolomon IslandsSomaliaSouth AfricaSouth AsiaSouth Asia (IDA & IBRD)South SudanSpainSri LankaSt. Kitts and NevisSt. LuciaSt. Martin (French part)St. Vincent and the GrenadinesSub-Saharan Africa Sub-Saharan Africa (excluding high income)Sub-Saharan Africa (IDA & IBRD countries)SudanSurinameSwazilandSwedenSwitzerlandSyrian Arab RepublicTajikistanTanzaniaThailandTimor-LesteTogoTongaTrinidad and TobagoTunisiaTurkeyTurkmenistanTurks and Caicos IslandsTuvaluUgandaUkraineUnited Arab EmiratesUnited KingdomUnited StatesUpper middle incomeUruguayUzbekistanVanuatuVenezuela, RBVietnamVirgin Islands (U.S.)West Bank and GazaWorldYemen, Rep.ZambiaZimbabwe línea de tiempo (timeline):
En esta escala de tiempo se presenta un gráfico de 1961 y 2016 de Ukraine. Los datos de 1960 están ausentes. El número de observaciones reales por fecha: 56.
Fuente (nombre):
Indicadores del desarrollo mundial
Fuente (organización):
Derived from total population. Population source: (1) United Nations Population Division. World Population Prospects, (2) United Nations Statistical Division. Population and Vital Statistics Report (various years), (3) Census reports and other statistical
Categorías:
Climate Change, Health
Se ha actualizado:
23 abr 2017 año
Los indicadores de los cambios de valor en los últimos años
Mínimo:
-1.007
1 ene 2001 año
Máximo:
1.261
1 ene 1962 año
A la fecha de observación
Valor
Cambio absoluto
El cambio con respecto al valor anterior
1 ene 1961 año
1.254
+1.254
0.0%
1 ene 1962 año
1.261
+0.007
0.54%
1 ene 1963 año
1.255
-0.006
-0.46%
1 ene 1964 año
1.219
-0.037
-2.93%
1 ene 1965 año
1.142
-0.077
-6.33%
1 ene 1966 año
1.039
-0.103
-9.02%
1 ene 1967 año
0.924
-0.114
-10.98%
1 ene 1968 año
0.824
-0.1
-10.83%
1 ene 1969 año
0.754
-0.07
-8.55%
1 ene 1970 año
0.725
-0.029
-3.84%
1 ene 1971 año
0.725
0.0
-0.01%
1 ene 1972 año
0.734
+0.009
1.3%
1 ene 1973 año
0.733
-0.001
-0.11%
1 ene 1974 año
0.718
-0.016
-2.16%
1 ene 1975 año
0.679
-0.039
-5.37%
1 ene 1976 año
0.625
-0.054
-7.95%
1 ene 1977 año
0.567
-0.058
-9.31%
1 ene 1978 año
0.516
-0.051
-8.91%
1 ene 1979 año
0.477
-0.04
-7.7%
1 ene 1980 año
0.452
-0.024
-5.09%
1 ene 1981 año
0.439
-0.014
-3.06%
1 ene 1982 año
0.503
+0.065
14.79%
1 ene 1983 año
0.324
-0.179
-35.63%
1 ene 1984 año
0.357
+0.033
10.05%
1 ene 1985 año
0.375
+0.018
5.17%
1 ene 1986 año
0.321
-0.054
-14.51%
1 ene 1987 año
0.353
+0.032
10.06%
1 ene 1988 año
0.383
+0.03
8.49%
1 ene 1989 año
0.444
+0.061
15.85%
1 ene 1990 año
0.488
+0.044
10.01%
1 ene 1991 año
0.23
-0.258
-52.95%
1 ene 1992 año
0.209
-0.021
-9.05%
1 ene 1993 año
0.288
+0.079
37.76%
1 ene 1994 año
0.055
-0.232
-80.71%
1 ene 1995 año
-0.496
-0.551
-993.93%
1 ene 1996 año
-0.79
-0.294
59.34%
1 ene 1997 año
-0.887
-0.097
12.28%
1 ene 1998 año
-0.911
-0.024
2.67%
1 ene 1999 año
-0.894
+0.017
-1.91%
1 ene 2000 año
-0.943
-0.049
5.5%
1 ene 2001 año
-1.007
-0.064
6.75%
1 ene 2002 año
-1.005
+0.001
-0.11%
1 ene 2003 año
-0.994
+0.012
-1.18%
1 ene 2004 año
-0.811
+0.182
-18.34%
1 ene 2005 año
-0.759
+0.053
-6.51%
1 ene 2006 año
-0.733
+0.026
-3.41%
1 ene 2007 año
-0.676
+0.057
-7.74%
1 ene 2008 año
-0.597
+0.079
-11.73%
1 ene 2009 año
-0.541
+0.055
-9.27%
1 ene 2010 año
-0.444
+0.098
-18.01%
1 ene 2011 año
-0.397
+0.047
-10.51%
1 ene 2012 año
-0.359
+0.038
-9.52%
1 ene 2013 año
-0.247
+0.112
-31.26%
1 ene 2014 año
-0.228
+0.019
-7.85%
1 ene 2015 año
-0.279
-0.051
22.49%
1 ene 2016 año
-0.364
-0.085
30.41%
Ranking de los países por los datos estadísticos actuales


Comentarios: