29
/es/
es
AIzaSyAYiBZKx7MnpbEhh9jyipgxe19OcubqV5w
April 1, 2024
75505
Azerbaijan
AZE
true
2
1
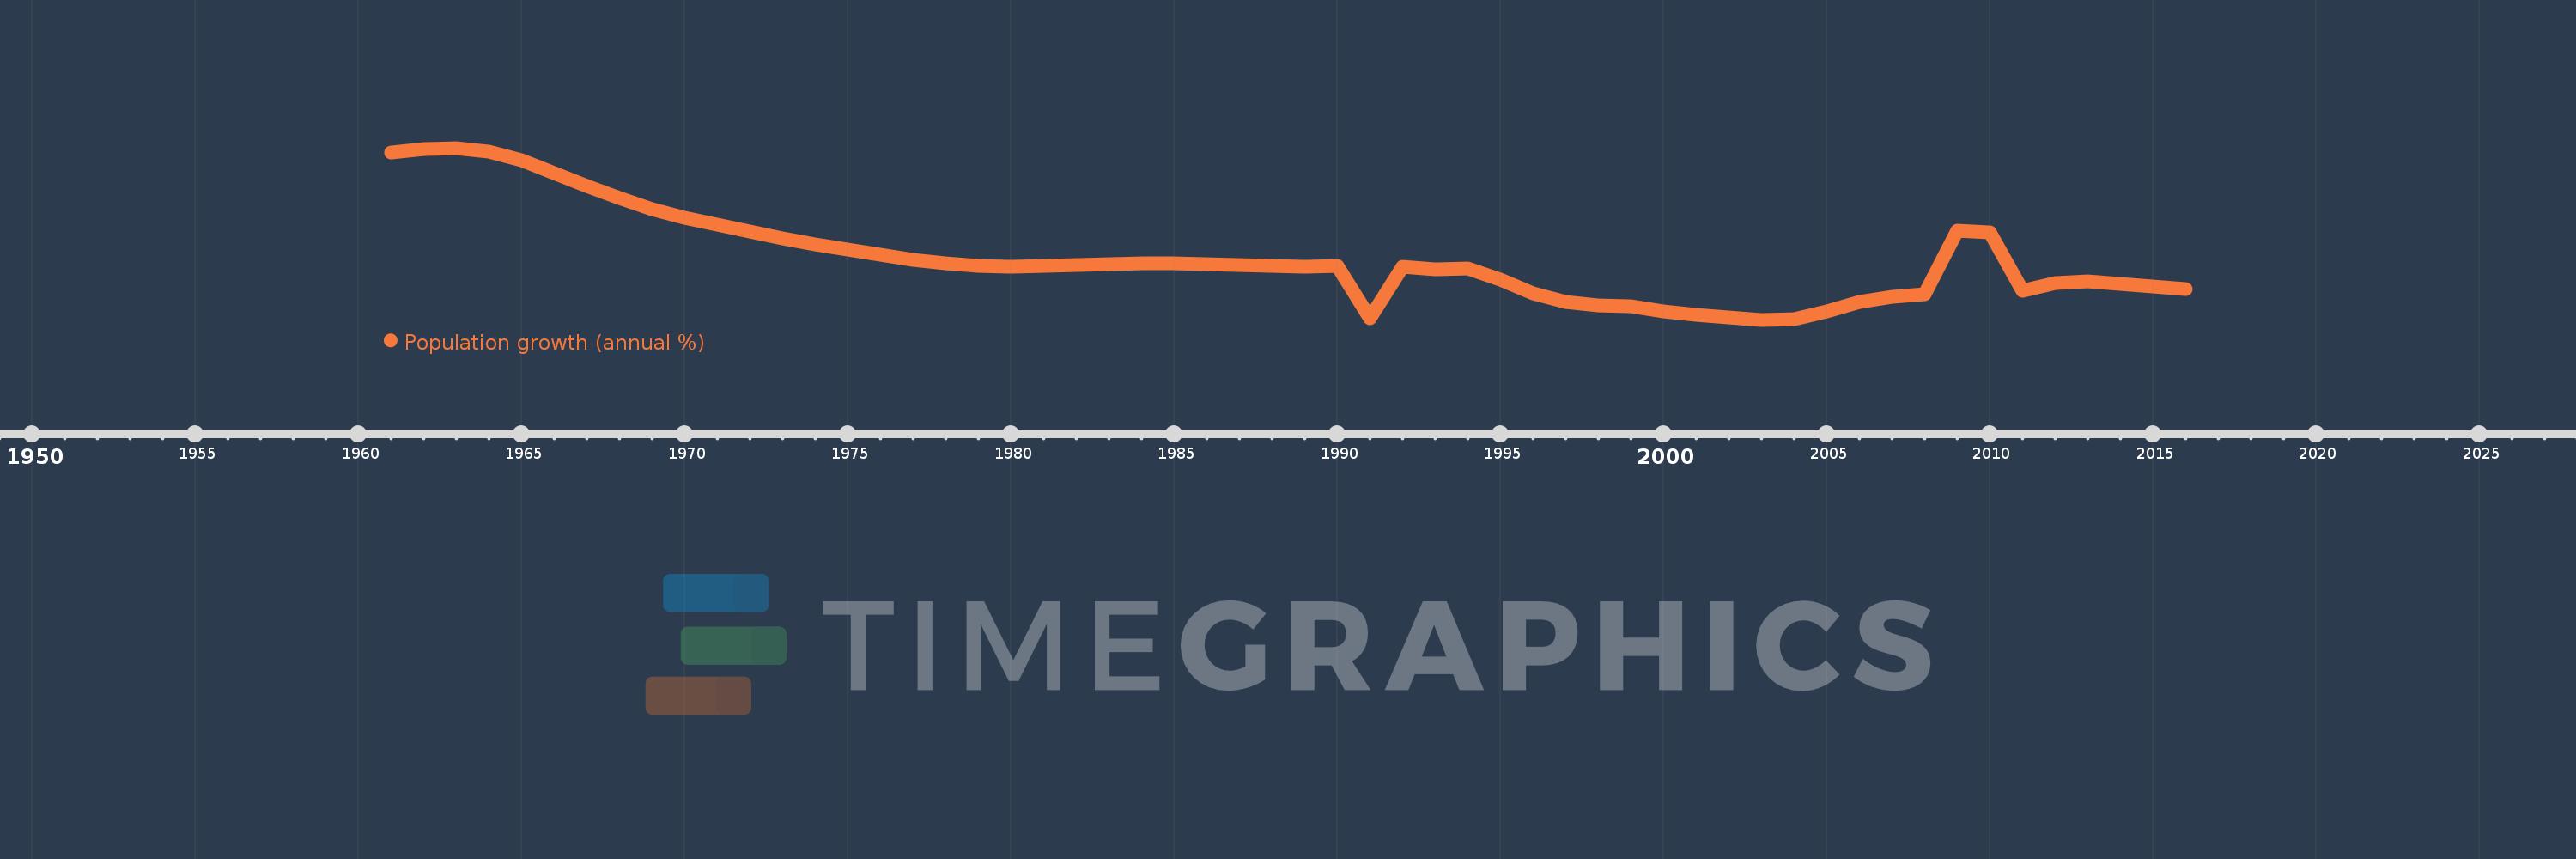
Population growth (annual %)
2016,2015,2014,2013,2012,2011,2010,2009,2008,2007,2006,2005,2004,2003,2002,2001,2000,1999,1998,1997,1996,1995,1994,1993,1992,1991,1990,1989,1988,1987,1986,1985,1984,1983,1982,1981,1980,1979,1978,1977,1976,1975,1974,1973,1972,1971,1970,1969,1968,1967,1966,1965,1964,1963,1962,1961
Estas estadísticas en otros países:
AfghanistanAlbaniaAlgeriaAmerican SamoaAndorraAngolaAntigua and BarbudaArab WorldArgentinaArmeniaArubaAustraliaAustriaAzerbaijanBahamas, TheBahrainBangladeshBarbadosBelarusBelgiumBelizeBeninBermudaBhutanBoliviaBosnia and HerzegovinaBotswanaBrazilBritish Virgin IslandsBrunei DarussalamBulgariaBurkina FasoBurundiCabo VerdeCambodiaCameroonCanadaCaribbean small statesCayman IslandsCentral African RepublicCentral Europe and the BalticsChadChannel IslandsChileChinaColombiaComorosCongo, Dem. Rep.Congo, Rep.Costa RicaCote d'IvoireCroatiaCubaCuracaoCyprusCzech RepublicDenmarkDjiboutiDominicaDominican RepublicEarly-demographic dividendEast Asia & PacificEast Asia & Pacific (excluding high income)East Asia & Pacific (IDA & IBRD countries)EcuadorEgypt, Arab Rep.El SalvadorEquatorial GuineaEritreaEstoniaEthiopiaEuro areaEurope & Central AsiaEurope & Central Asia (excluding high income)Europe & Central Asia (IDA & IBRD countries)European UnionFaroe IslandsFijiFinlandFragile and conflict affected situationsFranceFrench PolynesiaGabonGambia, TheGeorgiaGermanyGhanaGibraltarGreeceGreenlandGrenadaGuamGuatemalaGuineaGuinea-BissauGuyanaHaitiHeavily indebted poor countries (HIPC)High incomeHondurasHong Kong SAR, ChinaHungaryIBRD onlyIcelandIDA & IBRD totalIDA blendIDA onlyIDA totalIndiaIndonesiaIran, Islamic Rep.IraqIrelandIsle of ManIsraelItalyJamaicaJapanJordanKazakhstanKenyaKiribatiKorea, Dem. People’s Rep.Korea, Rep.KosovoKuwaitKyrgyz RepublicLao PDRLate-demographic dividendLatin America & Caribbean Latin America & Caribbean (excluding high income)Latin America & the Caribbean (IDA & IBRD countries)LatviaLeast developed countries: UN classificationLebanonLesothoLiberiaLibyaLiechtensteinLithuaniaLow & middle incomeLow incomeLower middle incomeLuxembourgMacao SAR, ChinaMacedonia, FYRMadagascarMalawiMalaysiaMaldivesMaliMaltaMarshall IslandsMauritaniaMauritiusMexicoMicronesia, Fed. Sts.Middle East & North AfricaMiddle East & North Africa (excluding high income)Middle East & North Africa (IDA & IBRD countries)Middle incomeMoldovaMonacoMongoliaMontenegroMoroccoMozambiqueMyanmarNamibiaNauruNepalNetherlandsNew CaledoniaNew ZealandNicaraguaNigerNigeriaNorth AmericaNorthern Mariana IslandsNorwayOECD membersOmanOther small statesPacific island small statesPakistanPalauPanamaPapua New GuineaParaguayPeruPhilippinesPolandPortugalPost-demographic dividendPre-demographic dividendPuerto RicoQatarRomaniaRussian FederationRwandaSamoaSan MarinoSao Tome and PrincipeSaudi ArabiaSenegalSerbiaSeychellesSierra LeoneSingaporeSint Maarten (Dutch part)Slovak RepublicSloveniaSmall statesSolomon IslandsSomaliaSouth AfricaSouth AsiaSouth Asia (IDA & IBRD)South SudanSpainSri LankaSt. Kitts and NevisSt. LuciaSt. Martin (French part)St. Vincent and the GrenadinesSub-Saharan Africa Sub-Saharan Africa (excluding high income)Sub-Saharan Africa (IDA & IBRD countries)SudanSurinameSwazilandSwedenSwitzerlandSyrian Arab RepublicTajikistanTanzaniaThailandTimor-LesteTogoTongaTrinidad and TobagoTunisiaTurkeyTurkmenistanTurks and Caicos IslandsTuvaluUgandaUkraineUnited Arab EmiratesUnited KingdomUnited StatesUpper middle incomeUruguayUzbekistanVanuatuVenezuela, RBVietnamVirgin Islands (U.S.)West Bank and GazaWorldYemen, Rep.ZambiaZimbabwe línea de tiempo (timeline):
En esta escala de tiempo se presenta un gráfico de 1961 y 2016 de Azerbaijan. Los datos de 1960 están ausentes. El número de observaciones reales por fecha: 56.
Fuente (nombre):
Indicadores del desarrollo mundial
Fuente (organización):
Derived from total population. Population source: (1) United Nations Population Division. World Population Prospects, (2) United Nations Statistical Division. Population and Vital Statistics Report (various years), (3) Census reports and other statistical
Categorías:
Climate Change, Health
Se ha actualizado:
23 abr 2017 año
Los indicadores de los cambios de valor en los últimos años
Mínimo:
0.746
1 ene 2003 año
Máximo:
3.353
1 ene 1963 año
A la fecha de observación
Valor
Cambio absoluto
El cambio con respecto al valor anterior
1 ene 1961 año
3.278
+3.278
0.0%
1 ene 1962 año
3.336
+0.058
1.78%
1 ene 1963 año
3.353
+0.017
0.5%
1 ene 1964 año
3.298
-0.055
-1.63%
1 ene 1965 año
3.161
-0.137
-4.16%
1 ene 1966 año
2.972
-0.189
-5.99%
1 ene 1967 año
2.772
-0.2
-6.73%
1 ene 1968 año
2.591
-0.181
-6.51%
1 ene 1969 año
2.43
-0.161
-6.21%
1 ene 1970 año
2.298
-0.132
-5.44%
1 ene 1971 año
2.188
-0.11
-4.79%
1 ene 1972 año
2.085
-0.103
-4.71%
1 ene 1973 año
1.983
-0.102
-4.89%
1 ene 1974 año
1.89
-0.093
-4.71%
1 ene 1975 año
1.805
-0.085
-4.49%
1 ene 1976 año
1.73
-0.075
-4.17%
1 ene 1977 año
1.659
-0.071
-4.08%
1 ene 1978 año
1.6
-0.06
-3.59%
1 ene 1979 año
1.563
-0.037
-2.3%
1 ene 1980 año
1.552
-0.01
-0.66%
1 ene 1981 año
1.561
+0.008
0.53%
1 ene 1982 año
1.577
+0.016
1.01%
1 ene 1983 año
1.59
+0.013
0.84%
1 ene 1984 año
1.598
+0.008
0.52%
1 ene 1985 año
1.597
-0.001
-0.05%
1 ene 1986 año
1.59
-0.008
-0.48%
1 ene 1987 año
1.574
-0.016
-1.0%
1 ene 1988 año
1.558
-0.016
-1.0%
1 ene 1989 año
1.552
-0.006
-0.38%
1 ene 1990 año
1.559
+0.007
0.47%
1 ene 1991 año
0.77
-0.789
-50.59%
1 ene 1992 año
1.552
+0.782
101.5%
1 ene 1993 año
1.515
-0.037
-2.4%
1 ene 1994 año
1.519
+0.004
0.27%
1 ene 1995 año
1.352
-0.167
-11.02%
1 ene 1996 año
1.152
-0.2
-14.8%
1 ene 1997 año
1.01
-0.142
-12.32%
1 ene 1998 año
0.965
-0.045
-4.47%
1 ene 1999 año
0.949
-0.016
-1.61%
1 ene 2000 año
0.878
-0.072
-7.54%
1 ene 2001 año
0.822
-0.056
-6.39%
1 ene 2002 año
0.775
-0.047
-5.69%
1 ene 2003 año
0.746
-0.029
-3.69%
1 ene 2004 año
0.758
+0.011
1.54%
1 ene 2005 año
0.875
+0.118
15.54%
1 ene 2006 año
1.022
+0.147
16.77%
1 ene 2007 año
1.099
+0.076
7.47%
1 ene 2008 año
1.134
+0.035
3.21%
1 ene 2009 año
2.1
+0.966
85.2%
1 ene 2010 año
2.076
-0.024
-1.13%
1 ene 2011 año
1.19
-0.886
-42.69%
1 ene 2012 año
1.303
+0.113
9.52%
1 ene 2013 año
1.329
+0.026
1.98%
1 ene 2014 año
1.293
-0.035
-2.66%
1 ene 2015 año
1.248
-0.045
-3.5%
1 ene 2016 año
1.212
-0.036
-2.9%
Ranking de los países por los datos estadísticos actuales


Comentarios: