29
/es/
es
AIzaSyAYiBZKx7MnpbEhh9jyipgxe19OcubqV5w
April 1, 2024
206233
Nauru
NRU
true
2
1
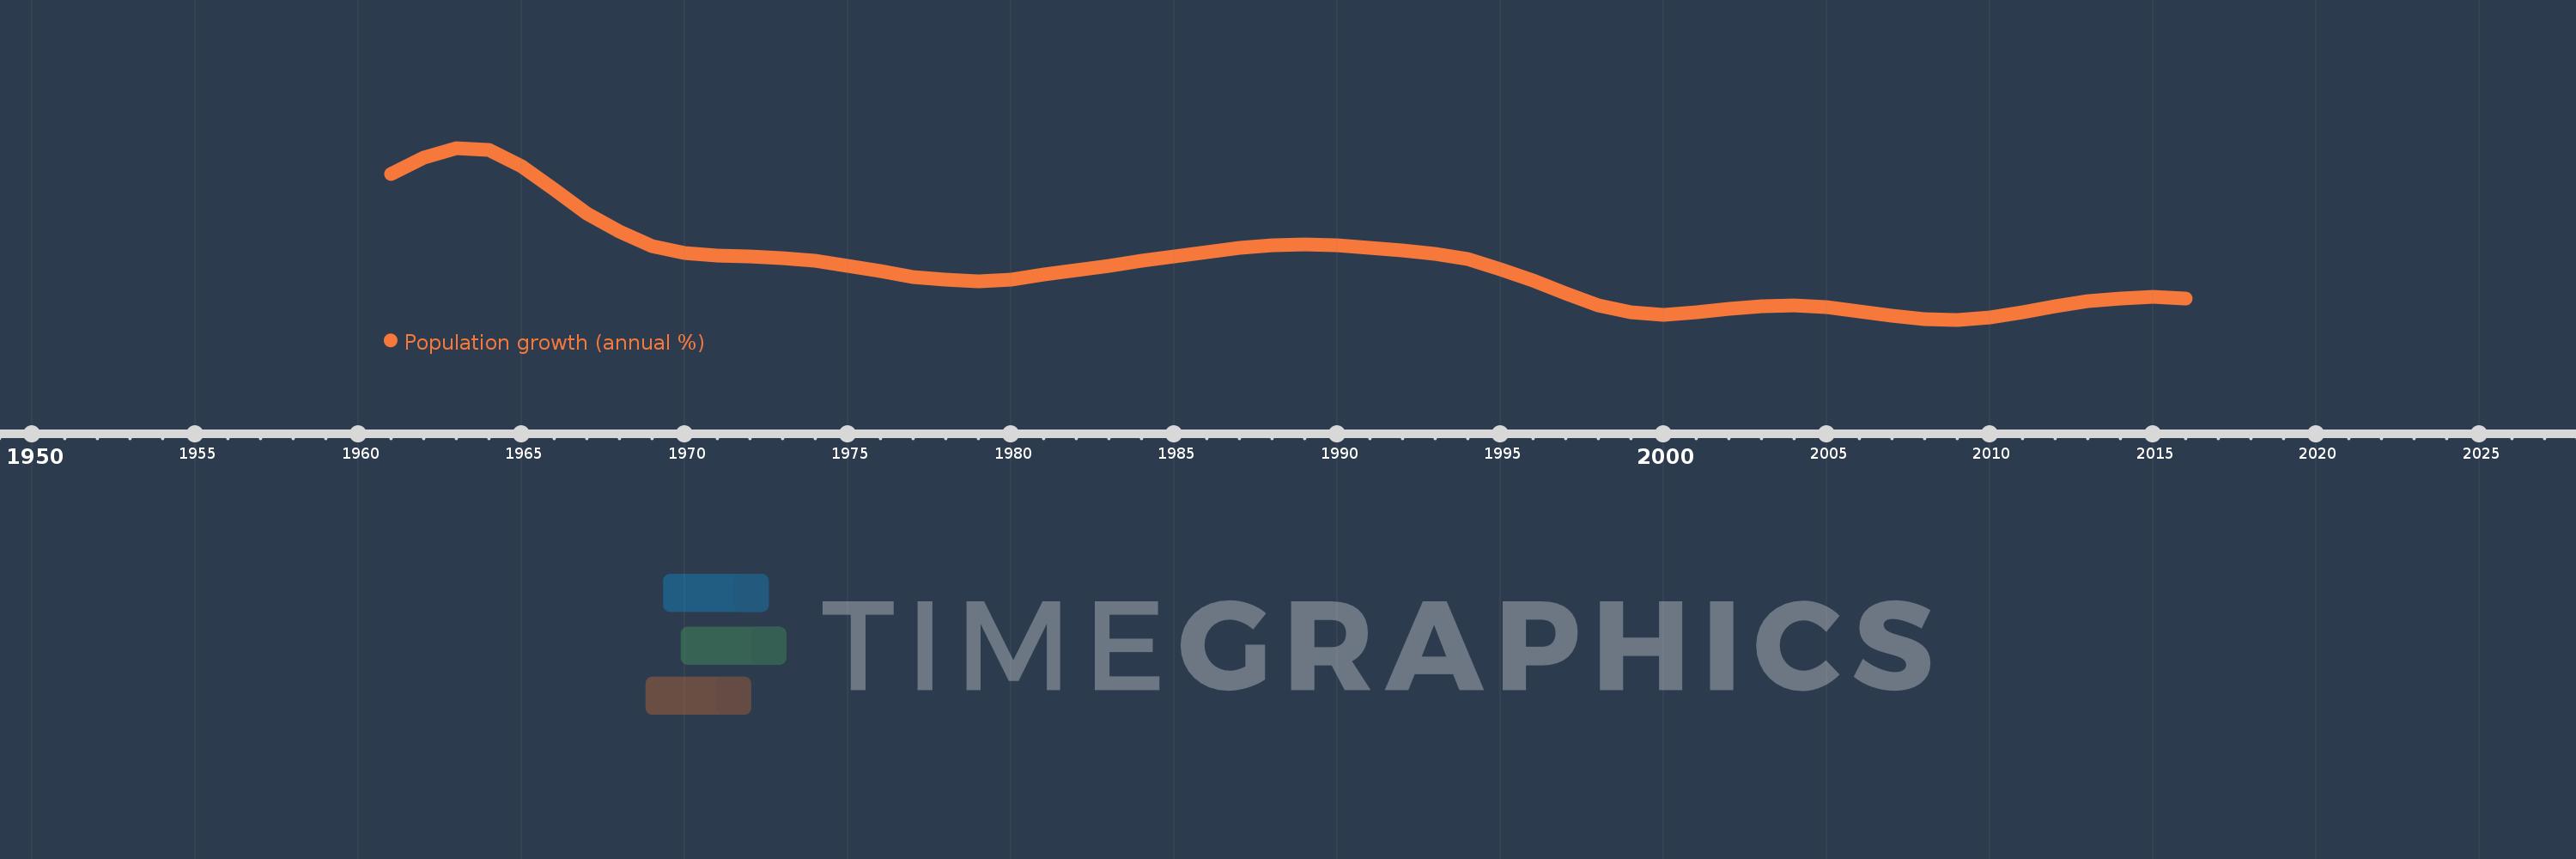
Population growth (annual %)
2016,2015,2014,2013,2012,2011,2010,2009,2008,2007,2006,2005,2004,2003,2002,2001,2000,1999,1998,1997,1996,1995,1994,1993,1992,1991,1990,1989,1988,1987,1986,1985,1984,1983,1982,1981,1980,1979,1978,1977,1976,1975,1974,1973,1972,1971,1970,1969,1968,1967,1966,1965,1964,1963,1962,1961
Estas estadísticas en otros países:
AfghanistanAlbaniaAlgeriaAmerican SamoaAndorraAngolaAntigua and BarbudaArab WorldArgentinaArmeniaArubaAustraliaAustriaAzerbaijanBahamas, TheBahrainBangladeshBarbadosBelarusBelgiumBelizeBeninBermudaBhutanBoliviaBosnia and HerzegovinaBotswanaBrazilBritish Virgin IslandsBrunei DarussalamBulgariaBurkina FasoBurundiCabo VerdeCambodiaCameroonCanadaCaribbean small statesCayman IslandsCentral African RepublicCentral Europe and the BalticsChadChannel IslandsChileChinaColombiaComorosCongo, Dem. Rep.Congo, Rep.Costa RicaCote d'IvoireCroatiaCubaCuracaoCyprusCzech RepublicDenmarkDjiboutiDominicaDominican RepublicEarly-demographic dividendEast Asia & PacificEast Asia & Pacific (excluding high income)East Asia & Pacific (IDA & IBRD countries)EcuadorEgypt, Arab Rep.El SalvadorEquatorial GuineaEritreaEstoniaEthiopiaEuro areaEurope & Central AsiaEurope & Central Asia (excluding high income)Europe & Central Asia (IDA & IBRD countries)European UnionFaroe IslandsFijiFinlandFragile and conflict affected situationsFranceFrench PolynesiaGabonGambia, TheGeorgiaGermanyGhanaGibraltarGreeceGreenlandGrenadaGuamGuatemalaGuineaGuinea-BissauGuyanaHaitiHeavily indebted poor countries (HIPC)High incomeHondurasHong Kong SAR, ChinaHungaryIBRD onlyIcelandIDA & IBRD totalIDA blendIDA onlyIDA totalIndiaIndonesiaIran, Islamic Rep.IraqIrelandIsle of ManIsraelItalyJamaicaJapanJordanKazakhstanKenyaKiribatiKorea, Dem. People’s Rep.Korea, Rep.KosovoKuwaitKyrgyz RepublicLao PDRLate-demographic dividendLatin America & Caribbean Latin America & Caribbean (excluding high income)Latin America & the Caribbean (IDA & IBRD countries)LatviaLeast developed countries: UN classificationLebanonLesothoLiberiaLibyaLiechtensteinLithuaniaLow & middle incomeLow incomeLower middle incomeLuxembourgMacao SAR, ChinaMacedonia, FYRMadagascarMalawiMalaysiaMaldivesMaliMaltaMarshall IslandsMauritaniaMauritiusMexicoMicronesia, Fed. Sts.Middle East & North AfricaMiddle East & North Africa (excluding high income)Middle East & North Africa (IDA & IBRD countries)Middle incomeMoldovaMonacoMongoliaMontenegroMoroccoMozambiqueMyanmarNamibiaNauruNepalNetherlandsNew CaledoniaNew ZealandNicaraguaNigerNigeriaNorth AmericaNorthern Mariana IslandsNorwayOECD membersOmanOther small statesPacific island small statesPakistanPalauPanamaPapua New GuineaParaguayPeruPhilippinesPolandPortugalPost-demographic dividendPre-demographic dividendPuerto RicoQatarRomaniaRussian FederationRwandaSamoaSan MarinoSao Tome and PrincipeSaudi ArabiaSenegalSerbiaSeychellesSierra LeoneSingaporeSint Maarten (Dutch part)Slovak RepublicSloveniaSmall statesSolomon IslandsSomaliaSouth AfricaSouth AsiaSouth Asia (IDA & IBRD)South SudanSpainSri LankaSt. Kitts and NevisSt. LuciaSt. Martin (French part)St. Vincent and the GrenadinesSub-Saharan Africa Sub-Saharan Africa (excluding high income)Sub-Saharan Africa (IDA & IBRD countries)SudanSurinameSwazilandSwedenSwitzerlandSyrian Arab RepublicTajikistanTanzaniaThailandTimor-LesteTogoTongaTrinidad and TobagoTunisiaTurkeyTurkmenistanTurks and Caicos IslandsTuvaluUgandaUkraineUnited Arab EmiratesUnited KingdomUnited StatesUpper middle incomeUruguayUzbekistanVanuatuVenezuela, RBVietnamVirgin Islands (U.S.)West Bank and GazaWorldYemen, Rep.ZambiaZimbabwe línea de tiempo (timeline):
En esta escala de tiempo se presenta un gráfico de 1961 y 2016 de Nauru. Los datos de 1960 están ausentes. El número de observaciones reales por fecha: 56.
Fuente (nombre):
Indicadores del desarrollo mundial
Fuente (organización):
Derived from total population. Population source: (1) United Nations Population Division. World Population Prospects, (2) United Nations Statistical Division. Population and Vital Statistics Report (various years), (3) Census reports and other statistical
Categorías:
Climate Change, Health
Se ha actualizado:
23 abr 2017 año
Los indicadores de los cambios de valor en los últimos años
Mínimo:
-0.278
1 ene 2009 año
Máximo:
5.655
1 ene 1963 año
A la fecha de observación
Valor
Cambio absoluto
El cambio con respecto al valor anterior
1 ene 1961 año
4.758
+4.758
0.0%
1 ene 1962 año
5.315
+0.557
11.7%
1 ene 1963 año
5.655
+0.34
6.4%
1 ene 1964 año
5.582
-0.073
-1.29%
1 ene 1965 año
5.015
-0.568
-10.17%
1 ene 1966 año
4.236
-0.778
-15.52%
1 ene 1967 año
3.392
-0.844
-19.92%
1 ene 1968 año
2.758
-0.634
-18.7%
1 ene 1969 año
2.252
-0.506
-18.34%
1 ene 1970 año
2.015
-0.238
-10.56%
1 ene 1971 año
1.944
-0.071
-3.5%
1 ene 1972 año
1.922
-0.022
-1.13%
1 ene 1973 año
1.856
-0.066
-3.43%
1 ene 1974 año
1.749
-0.107
-5.75%
1 ene 1975 año
1.59
-0.159
-9.09%
1 ene 1976 año
1.396
-0.194
-12.23%
1 ene 1977 año
1.209
-0.187
-13.38%
1 ene 1978 año
1.098
-0.111
-9.19%
1 ene 1979 año
1.045
-0.053
-4.82%
1 ene 1980 año
1.115
+0.07
6.74%
1 ene 1981 año
1.277
+0.161
14.48%
1 ene 1982 año
1.445
+0.168
13.19%
1 ene 1983 año
1.593
+0.148
10.24%
1 ene 1984 año
1.747
+0.153
9.63%
1 ene 1985 año
1.917
+0.17
9.74%
1 ene 1986 año
2.064
+0.148
7.7%
1 ene 1987 año
2.202
+0.138
6.68%
1 ene 1988 año
2.295
+0.093
4.22%
1 ene 1989 año
2.335
+0.04
1.74%
1 ene 1990 año
2.304
-0.031
-1.33%
1 ene 1991 año
2.219
-0.085
-3.67%
1 ene 1992 año
2.129
-0.091
-4.1%
1 ene 1993 año
2.011
-0.118
-5.53%
1 ene 1994 año
1.817
-0.194
-9.64%
1 ene 1995 año
1.471
-0.346
-19.06%
1 ene 1996 año
1.079
-0.392
-26.64%
1 ene 1997 año
0.63
-0.449
-41.62%
1 ene 1998 año
0.229
-0.401
-63.65%
1 ene 1999 año
-0.02
-0.249
-108.69%
1 ene 2000 año
-0.1
-0.08
400.3%
1 ene 2001 año
-0.02
+0.08
-79.99%
1 ene 2002 año
0.109
+0.129
-649.75%
1 ene 2003 año
0.199
+0.089
81.54%
1 ene 2004 año
0.228
+0.029
14.75%
1 ene 2005 año
0.168
-0.06
-26.23%
1 ene 2006 año
0.02
-0.148
-88.25%
1 ene 2007 año
-0.139
-0.158
-800.42%
1 ene 2008 año
-0.258
-0.119
86.08%
1 ene 2009 año
-0.278
-0.021
7.98%
1 ene 2010 año
-0.189
+0.089
-31.98%
1 ene 2011 año
-0.03
+0.159
-84.19%
1 ene 2012 año
0.179
+0.209
-699.55%
1 ene 2013 año
0.358
+0.178
99.46%
1 ene 2014 año
0.455
+0.098
27.26%
1 ene 2015 año
0.502
+0.047
10.34%
1 ene 2016 año
0.451
-0.051
-10.23%
Ranking de los países por los datos estadísticos actuales


Comentarios: