29
/es/
es
AIzaSyAYiBZKx7MnpbEhh9jyipgxe19OcubqV5w
April 1, 2024
268488
Tunisia
TUN
true
2
1
Population growth (annual %)
2016,2015,2014,2013,2012,2011,2010,2009,2008,2007,2006,2005,2004,2003,2002,2001,2000,1999,1998,1997,1996,1995,1994,1993,1992,1991,1990,1989,1988,1987,1986,1985,1984,1983,1982,1981,1980,1979,1978,1977,1976,1975,1974,1973,1972,1971,1970,1969,1968,1967,1966,1965,1964,1963,1962,1961
Estas estadísticas en otros países:
AfghanistanAlbaniaAlgeriaAmerican SamoaAndorraAngolaAntigua and BarbudaArab WorldArgentinaArmeniaArubaAustraliaAustriaAzerbaijanBahamas, TheBahrainBangladeshBarbadosBelarusBelgiumBelizeBeninBermudaBhutanBoliviaBosnia and HerzegovinaBotswanaBrazilBritish Virgin IslandsBrunei DarussalamBulgariaBurkina FasoBurundiCabo VerdeCambodiaCameroonCanadaCaribbean small statesCayman IslandsCentral African RepublicCentral Europe and the BalticsChadChannel IslandsChileChinaColombiaComorosCongo, Dem. Rep.Congo, Rep.Costa RicaCote d'IvoireCroatiaCubaCuracaoCyprusCzech RepublicDenmarkDjiboutiDominicaDominican RepublicEarly-demographic dividendEast Asia & PacificEast Asia & Pacific (excluding high income)East Asia & Pacific (IDA & IBRD countries)EcuadorEgypt, Arab Rep.El SalvadorEquatorial GuineaEritreaEstoniaEthiopiaEuro areaEurope & Central AsiaEurope & Central Asia (excluding high income)Europe & Central Asia (IDA & IBRD countries)European UnionFaroe IslandsFijiFinlandFragile and conflict affected situationsFranceFrench PolynesiaGabonGambia, TheGeorgiaGermanyGhanaGibraltarGreeceGreenlandGrenadaGuamGuatemalaGuineaGuinea-BissauGuyanaHaitiHeavily indebted poor countries (HIPC)High incomeHondurasHong Kong SAR, ChinaHungaryIBRD onlyIcelandIDA & IBRD totalIDA blendIDA onlyIDA totalIndiaIndonesiaIran, Islamic Rep.IraqIrelandIsle of ManIsraelItalyJamaicaJapanJordanKazakhstanKenyaKiribatiKorea, Dem. People’s Rep.Korea, Rep.KosovoKuwaitKyrgyz RepublicLao PDRLate-demographic dividendLatin America & Caribbean Latin America & Caribbean (excluding high income)Latin America & the Caribbean (IDA & IBRD countries)LatviaLeast developed countries: UN classificationLebanonLesothoLiberiaLibyaLiechtensteinLithuaniaLow & middle incomeLow incomeLower middle incomeLuxembourgMacao SAR, ChinaMacedonia, FYRMadagascarMalawiMalaysiaMaldivesMaliMaltaMarshall IslandsMauritaniaMauritiusMexicoMicronesia, Fed. Sts.Middle East & North AfricaMiddle East & North Africa (excluding high income)Middle East & North Africa (IDA & IBRD countries)Middle incomeMoldovaMonacoMongoliaMontenegroMoroccoMozambiqueMyanmarNamibiaNauruNepalNetherlandsNew CaledoniaNew ZealandNicaraguaNigerNigeriaNorth AmericaNorthern Mariana IslandsNorwayOECD membersOmanOther small statesPacific island small statesPakistanPalauPanamaPapua New GuineaParaguayPeruPhilippinesPolandPortugalPost-demographic dividendPre-demographic dividendPuerto RicoQatarRomaniaRussian FederationRwandaSamoaSan MarinoSao Tome and PrincipeSaudi ArabiaSenegalSerbiaSeychellesSierra LeoneSingaporeSint Maarten (Dutch part)Slovak RepublicSloveniaSmall statesSolomon IslandsSomaliaSouth AfricaSouth AsiaSouth Asia (IDA & IBRD)South SudanSpainSri LankaSt. Kitts and NevisSt. LuciaSt. Martin (French part)St. Vincent and the GrenadinesSub-Saharan Africa Sub-Saharan Africa (excluding high income)Sub-Saharan Africa (IDA & IBRD countries)SudanSurinameSwazilandSwedenSwitzerlandSyrian Arab RepublicTajikistanTanzaniaThailandTimor-LesteTogoTongaTrinidad and TobagoTunisiaTurkeyTurkmenistanTurks and Caicos IslandsTuvaluUgandaUkraineUnited Arab EmiratesUnited KingdomUnited StatesUpper middle incomeUruguayUzbekistanVanuatuVenezuela, RBVietnamVirgin Islands (U.S.)West Bank and GazaWorldYemen, Rep.ZambiaZimbabwe línea de tiempo (timeline):
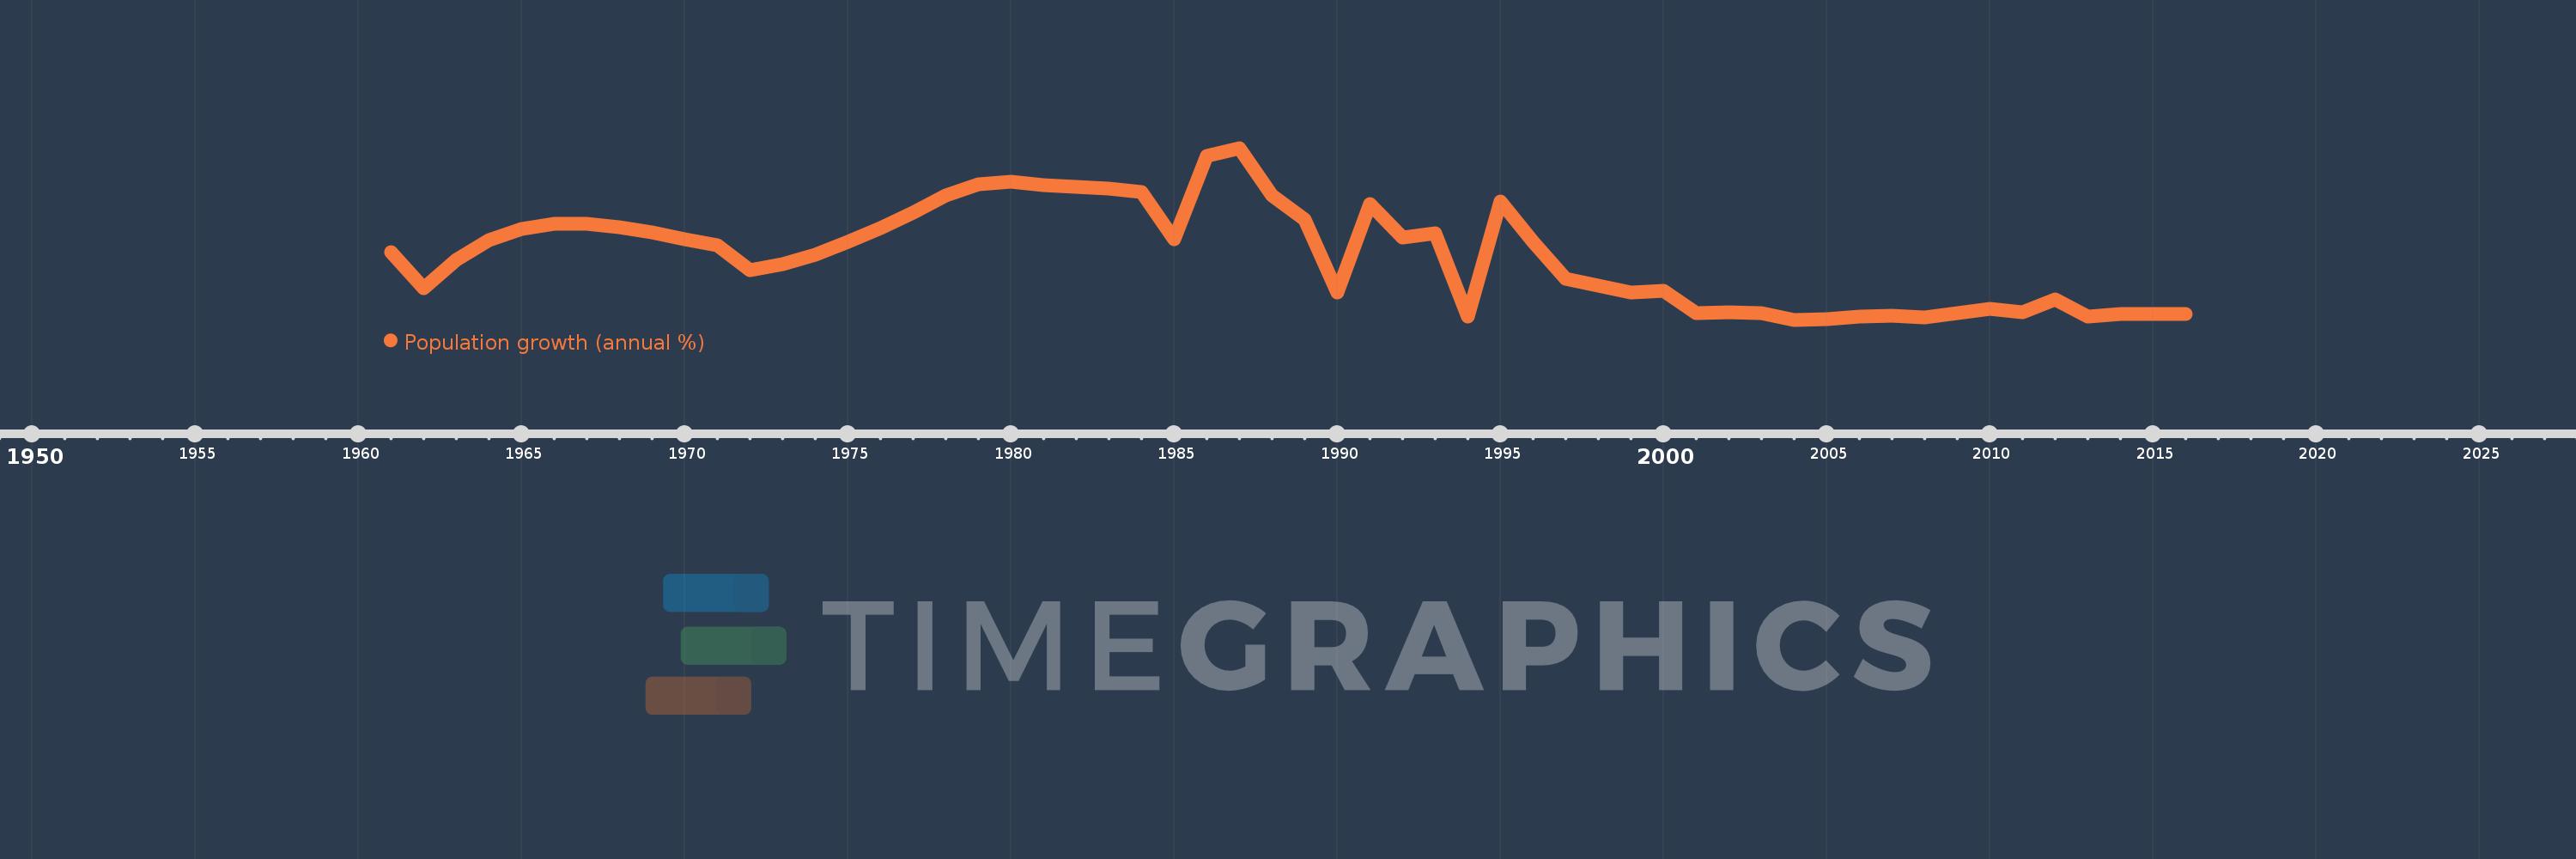
En esta escala de tiempo se presenta un gráfico de 1961 y 2016 de Tunisia. Los datos de 1960 están ausentes. El número de observaciones reales por fecha: 56.
Fuente (nombre):
Indicadores del desarrollo mundial
Fuente (organización):
Derived from total population. Population source: (1) United Nations Population Division. World Population Prospects, (2) United Nations Statistical Division. Population and Vital Statistics Report (various years), (3) Census reports and other statistical
Categorías:
Climate Change, Health
Se ha actualizado:
23 abr 2017 año
Los indicadores de los cambios de valor en los últimos años
Mínimo:
0.928
1 ene 2004 año
Máximo:
3.149
1 ene 1987 año
A la fecha de observación
Valor
Cambio absoluto
El cambio con respecto al valor anterior
1 ene 1961 año
1.8
+1.8
0.0%
1 ene 1962 año
1.334
-0.466
-25.91%
1 ene 1963 año
1.702
+0.369
27.64%
1 ene 1964 año
1.954
+0.251
14.76%
1 ene 1965 año
2.101
+0.147
7.54%
1 ene 1966 año
2.165
+0.064
3.06%
1 ene 1967 año
2.166
+0.001
0.06%
1 ene 1968 año
2.123
-0.043
-1.99%
1 ene 1969 año
2.052
-0.071
-3.34%
1 ene 1970 año
1.969
-0.084
-4.07%
1 ene 1971 año
1.886
-0.083
-4.2%
1 ene 1972 año
1.57
-0.316
-16.73%
1 ene 1973 año
1.641
+0.071
4.49%
1 ene 1974 año
1.767
+0.126
7.68%
1 ene 1975 año
1.93
+0.163
9.22%
1 ene 1976 año
2.112
+0.182
9.44%
1 ene 1977 año
2.314
+0.201
9.54%
1 ene 1978 año
2.534
+0.22
9.51%
1 ene 1979 año
2.678
+0.144
5.69%
1 ene 1980 año
2.709
+0.032
1.18%
1 ene 1981 año
2.672
-0.038
-1.39%
1 ene 1982 año
2.646
-0.026
-0.96%
1 ene 1983 año
2.62
-0.026
-1.0%
1 ene 1984 año
2.581
-0.038
-1.47%
1 ene 1985 año
1.97
-0.611
-23.66%
1 ene 1986 año
3.046
+1.075
54.58%
1 ene 1987 año
3.149
+0.103
3.39%
1 ene 1988 año
2.532
-0.617
-19.6%
1 ene 1989 año
2.225
-0.307
-12.13%
1 ene 1990 año
1.278
-0.946
-42.54%
1 ene 1991 año
2.429
+1.151
90.06%
1 ene 1992 año
1.989
-0.44
-18.13%
1 ene 1993 año
2.043
+0.054
2.73%
1 ene 1994 año
0.965
-1.078
-52.78%
1 ene 1995 año
2.46
+1.495
155.01%
1 ene 1996 año
1.937
-0.524
-21.28%
1 ene 1997 año
1.461
-0.476
-24.57%
1 ene 1998 año
1.372
-0.088
-6.04%
1 ene 1999 año
1.277
-0.096
-6.97%
1 ene 2000 año
1.305
+0.028
2.22%
1 ene 2001 año
1.016
-0.289
-22.12%
1 ene 2002 año
1.022
+0.005
0.52%
1 ene 2003 año
1.013
-0.008
-0.81%
1 ene 2004 año
0.928
-0.085
-8.42%
1 ene 2005 año
0.937
+0.009
0.92%
1 ene 2006 año
0.968
+0.031
3.33%
1 ene 2007 año
0.981
+0.013
1.39%
1 ene 2008 año
0.955
-0.026
-2.67%
1 ene 2009 año
1.01
+0.055
5.75%
1 ene 2010 año
1.066
+0.056
5.55%
1 ene 2011 año
1.024
-0.042
-3.9%
1 ene 2012 año
1.194
+0.17
16.56%
1 ene 2013 año
0.967
-0.227
-19.03%
1 ene 2014 año
1.006
+0.039
4.08%
1 ene 2015 año
1.006
0.0
0.0%
1 ene 2016 año
1.006
0.0
-0.01%
Ranking de los países por los datos estadísticos actuales


Comentarios: