29
/es/
es
AIzaSyAYiBZKx7MnpbEhh9jyipgxe19OcubqV5w
April 1, 2024
116158
Cuba
CUB
true
2
1
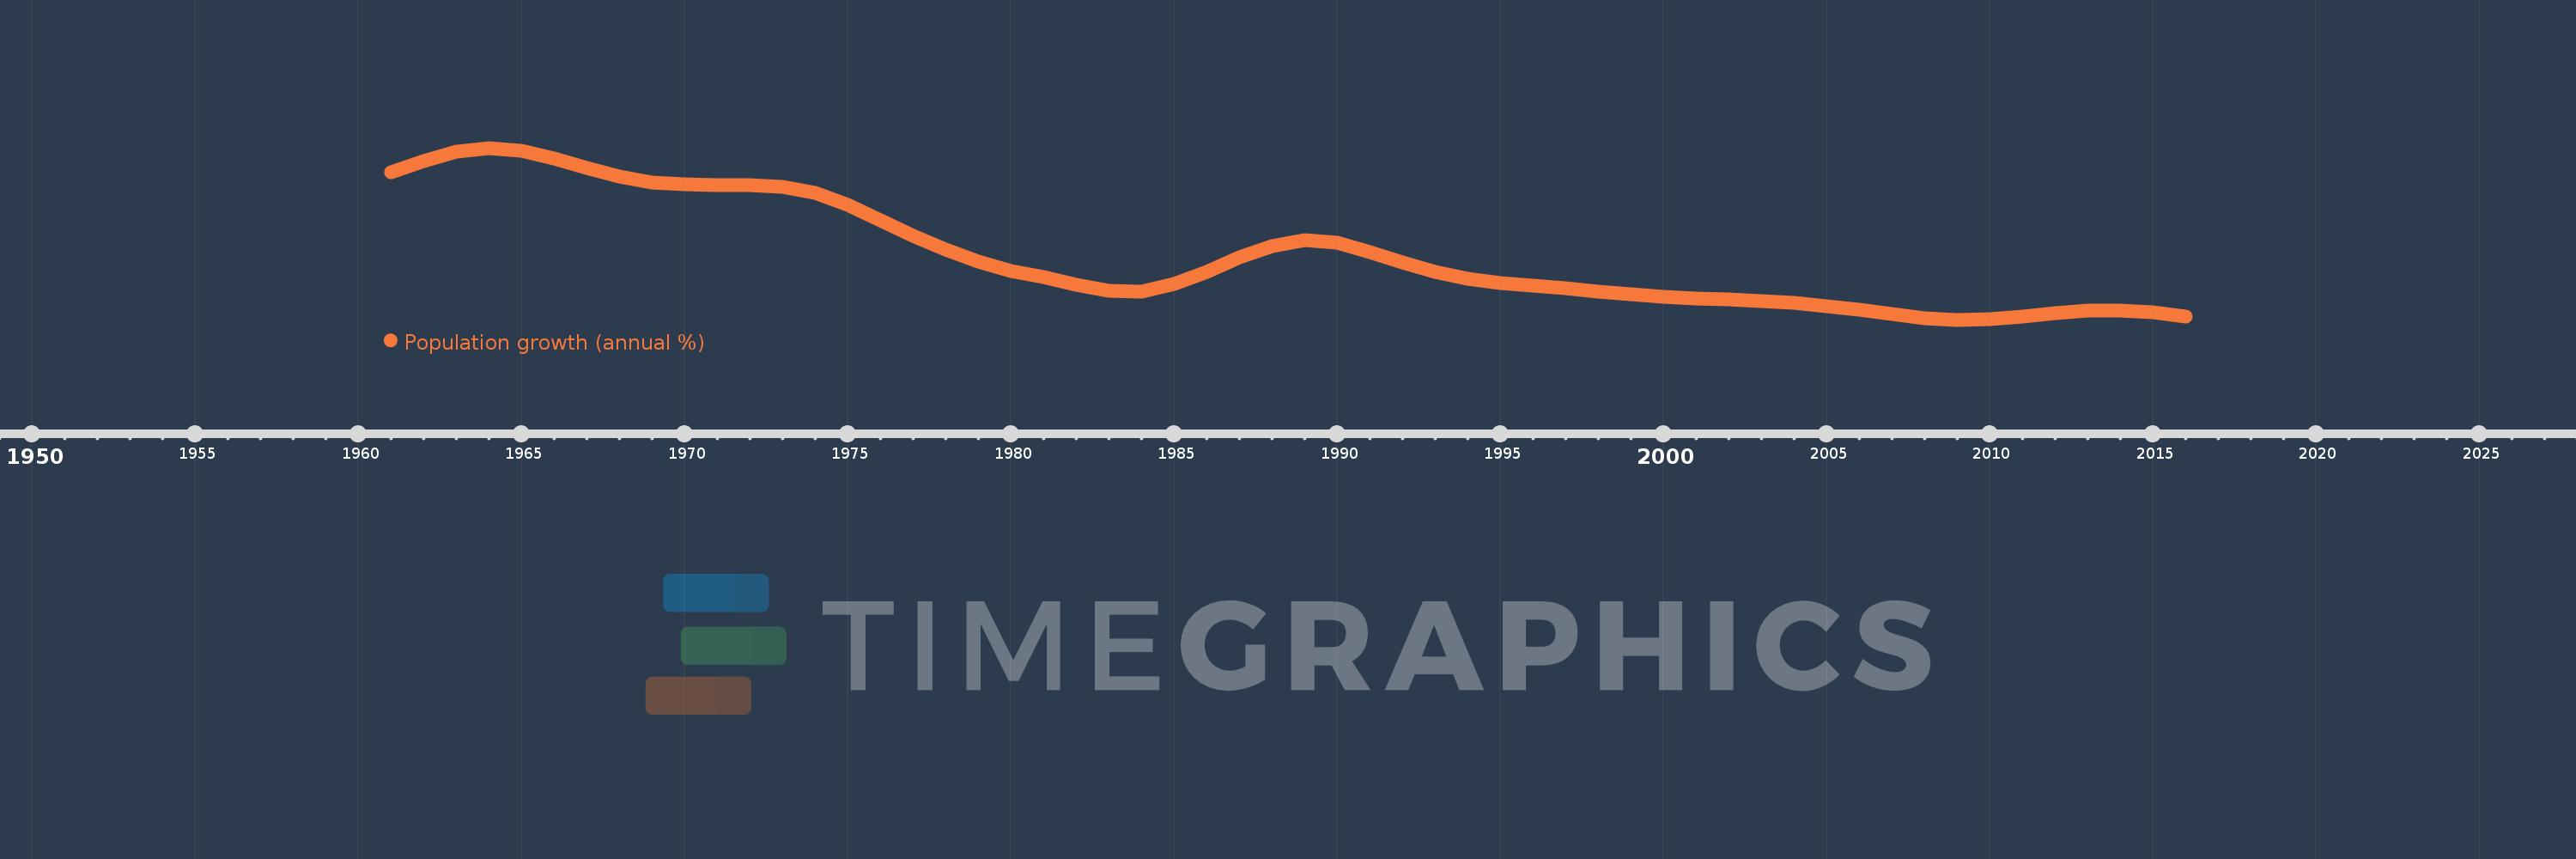
Population growth (annual %)
2016,2015,2014,2013,2012,2011,2010,2009,2008,2007,2006,2005,2004,2003,2002,2001,2000,1999,1998,1997,1996,1995,1994,1993,1992,1991,1990,1989,1988,1987,1986,1985,1984,1983,1982,1981,1980,1979,1978,1977,1976,1975,1974,1973,1972,1971,1970,1969,1968,1967,1966,1965,1964,1963,1962,1961
Estas estadísticas en otros países:
AfghanistanAlbaniaAlgeriaAmerican SamoaAndorraAngolaAntigua and BarbudaArab WorldArgentinaArmeniaArubaAustraliaAustriaAzerbaijanBahamas, TheBahrainBangladeshBarbadosBelarusBelgiumBelizeBeninBermudaBhutanBoliviaBosnia and HerzegovinaBotswanaBrazilBritish Virgin IslandsBrunei DarussalamBulgariaBurkina FasoBurundiCabo VerdeCambodiaCameroonCanadaCaribbean small statesCayman IslandsCentral African RepublicCentral Europe and the BalticsChadChannel IslandsChileChinaColombiaComorosCongo, Dem. Rep.Congo, Rep.Costa RicaCote d'IvoireCroatiaCubaCuracaoCyprusCzech RepublicDenmarkDjiboutiDominicaDominican RepublicEarly-demographic dividendEast Asia & PacificEast Asia & Pacific (excluding high income)East Asia & Pacific (IDA & IBRD countries)EcuadorEgypt, Arab Rep.El SalvadorEquatorial GuineaEritreaEstoniaEthiopiaEuro areaEurope & Central AsiaEurope & Central Asia (excluding high income)Europe & Central Asia (IDA & IBRD countries)European UnionFaroe IslandsFijiFinlandFragile and conflict affected situationsFranceFrench PolynesiaGabonGambia, TheGeorgiaGermanyGhanaGibraltarGreeceGreenlandGrenadaGuamGuatemalaGuineaGuinea-BissauGuyanaHaitiHeavily indebted poor countries (HIPC)High incomeHondurasHong Kong SAR, ChinaHungaryIBRD onlyIcelandIDA & IBRD totalIDA blendIDA onlyIDA totalIndiaIndonesiaIran, Islamic Rep.IraqIrelandIsle of ManIsraelItalyJamaicaJapanJordanKazakhstanKenyaKiribatiKorea, Dem. People’s Rep.Korea, Rep.KosovoKuwaitKyrgyz RepublicLao PDRLate-demographic dividendLatin America & Caribbean Latin America & Caribbean (excluding high income)Latin America & the Caribbean (IDA & IBRD countries)LatviaLeast developed countries: UN classificationLebanonLesothoLiberiaLibyaLiechtensteinLithuaniaLow & middle incomeLow incomeLower middle incomeLuxembourgMacao SAR, ChinaMacedonia, FYRMadagascarMalawiMalaysiaMaldivesMaliMaltaMarshall IslandsMauritaniaMauritiusMexicoMicronesia, Fed. Sts.Middle East & North AfricaMiddle East & North Africa (excluding high income)Middle East & North Africa (IDA & IBRD countries)Middle incomeMoldovaMonacoMongoliaMontenegroMoroccoMozambiqueMyanmarNamibiaNauruNepalNetherlandsNew CaledoniaNew ZealandNicaraguaNigerNigeriaNorth AmericaNorthern Mariana IslandsNorwayOECD membersOmanOther small statesPacific island small statesPakistanPalauPanamaPapua New GuineaParaguayPeruPhilippinesPolandPortugalPost-demographic dividendPre-demographic dividendPuerto RicoQatarRomaniaRussian FederationRwandaSamoaSan MarinoSao Tome and PrincipeSaudi ArabiaSenegalSerbiaSeychellesSierra LeoneSingaporeSint Maarten (Dutch part)Slovak RepublicSloveniaSmall statesSolomon IslandsSomaliaSouth AfricaSouth AsiaSouth Asia (IDA & IBRD)South SudanSpainSri LankaSt. Kitts and NevisSt. LuciaSt. Martin (French part)St. Vincent and the GrenadinesSub-Saharan Africa Sub-Saharan Africa (excluding high income)Sub-Saharan Africa (IDA & IBRD countries)SudanSurinameSwazilandSwedenSwitzerlandSyrian Arab RepublicTajikistanTanzaniaThailandTimor-LesteTogoTongaTrinidad and TobagoTunisiaTurkeyTurkmenistanTurks and Caicos IslandsTuvaluUgandaUkraineUnited Arab EmiratesUnited KingdomUnited StatesUpper middle incomeUruguayUzbekistanVanuatuVenezuela, RBVietnamVirgin Islands (U.S.)West Bank and GazaWorldYemen, Rep.ZambiaZimbabwe línea de tiempo (timeline):
En esta escala de tiempo se presenta un gráfico de 1961 y 2016 de Cuba. Los datos de 1960 están ausentes. El número de observaciones reales por fecha: 56.
Fuente (nombre):
Indicadores del desarrollo mundial
Fuente (organización):
Derived from total population. Population source: (1) United Nations Population Division. World Population Prospects, (2) United Nations Statistical Division. Population and Vital Statistics Report (various years), (3) Census reports and other statistical
Categorías:
Climate Change, Health
Se ha actualizado:
23 abr 2017 año
Los indicadores de los cambios de valor en los últimos años
Mínimo:
0.055
1 ene 2009 año
Máximo:
2.229
1 ene 1964 año
A la fecha de observación
Valor
Cambio absoluto
El cambio con respecto al valor anterior
1 ene 1961 año
1.918
+1.918
0.0%
1 ene 1962 año
2.061
+0.143
7.47%
1 ene 1963 año
2.179
+0.118
5.72%
1 ene 1964 año
2.229
+0.05
2.32%
1 ene 1965 año
2.191
-0.038
-1.7%
1 ene 1966 año
2.094
-0.097
-4.45%
1 ene 1967 año
1.974
-0.12
-5.75%
1 ene 1968 año
1.87
-0.103
-5.23%
1 ene 1969 año
1.796
-0.074
-3.96%
1 ene 1970 año
1.766
-0.031
-1.71%
1 ene 1971 año
1.759
-0.007
-0.39%
1 ene 1972 año
1.761
+0.002
0.13%
1 ene 1973 año
1.736
-0.025
-1.42%
1 ene 1974 año
1.657
-0.08
-4.58%
1 ene 1975 año
1.507
-0.15
-9.03%
1 ene 1976 año
1.313
-0.194
-12.9%
1 ene 1977 año
1.115
-0.198
-15.05%
1 ene 1978 año
0.943
-0.172
-15.44%
1 ene 1979 año
0.793
-0.15
-15.88%
1 ene 1980 año
0.676
-0.117
-14.74%
1 ene 1981 año
0.59
-0.086
-12.7%
1 ene 1982 año
0.497
-0.093
-15.74%
1 ene 1983 año
0.418
-0.079
-15.97%
1 ene 1984 año
0.413
-0.005
-1.1%
1 ene 1985 año
0.504
+0.09
21.85%
1 ene 1986 año
0.656
+0.152
30.24%
1 ene 1987 año
0.84
+0.184
27.98%
1 ene 1988 año
0.991
+0.152
18.05%
1 ene 1989 año
1.064
+0.072
7.31%
1 ene 1990 año
1.026
-0.038
-3.54%
1 ene 1991 año
0.911
-0.115
-11.2%
1 ene 1992 año
0.777
-0.135
-14.76%
1 ene 1993 año
0.665
-0.111
-14.31%
1 ene 1994 año
0.574
-0.092
-13.76%
1 ene 1995 año
0.516
-0.058
-10.04%
1 ene 1996 año
0.484
-0.033
-6.31%
1 ene 1997 año
0.451
-0.032
-6.69%
1 ene 1998 año
0.41
-0.041
-9.04%
1 ene 1999 año
0.376
-0.034
-8.34%
1 ene 2000 año
0.349
-0.027
-7.21%
1 ene 2001 año
0.327
-0.022
-6.36%
1 ene 2002 año
0.312
-0.015
-4.7%
1 ene 2003 año
0.296
-0.015
-4.95%
1 ene 2004 año
0.271
-0.026
-8.64%
1 ene 2005 año
0.23
-0.04
-14.91%
1 ene 2006 año
0.181
-0.049
-21.33%
1 ene 2007 año
0.126
-0.056
-30.66%
1 ene 2008 año
0.078
-0.047
-37.55%
1 ene 2009 año
0.055
-0.024
-29.99%
1 ene 2010 año
0.064
+0.009
16.18%
1 ene 2011 año
0.095
+0.031
48.31%
1 ene 2012 año
0.136
+0.042
44.23%
1 ene 2013 año
0.168
+0.032
23.29%
1 ene 2014 año
0.175
+0.007
4.09%
1 ene 2015 año
0.146
-0.029
-16.58%
1 ene 2016 año
0.092
-0.054
-37.14%
Ranking de los países por los datos estadísticos actuales


Comentarios: