29
/es/
es
AIzaSyAYiBZKx7MnpbEhh9jyipgxe19OcubqV5w
April 1, 2024
85326
Bermuda
BMU
true
2
1
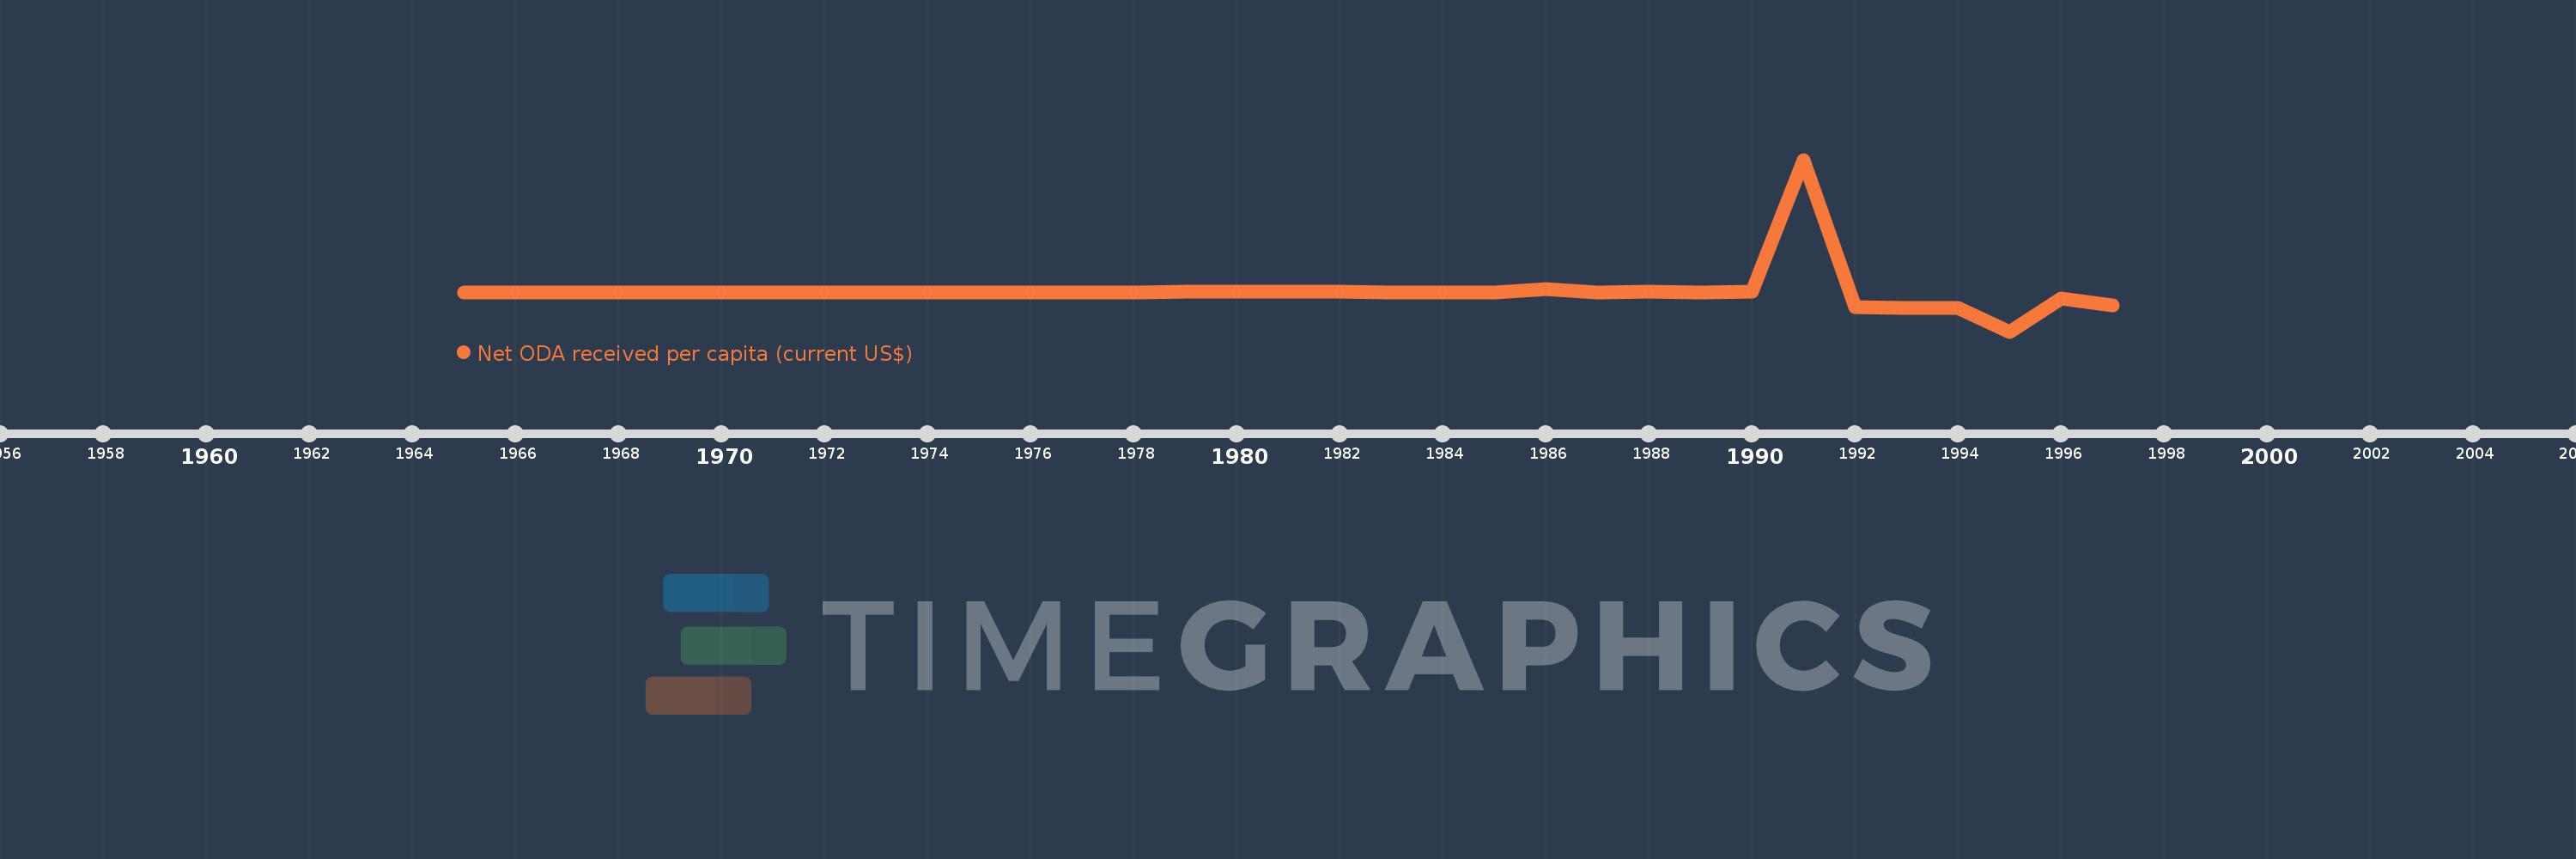
Net ODA received per capita (current US$)
1997,1996,1995,1994,1993,1992,1991,1990,1989,1988,1987,1986,1985,1984,1983,1982,1981,1980,1979,1978,1977,1976,1975,1973,1971,1970,1969,1968,1967,1966,1965
Estas estadísticas en otros países:
AfghanistanAlbaniaAlgeriaAngolaAntigua and BarbudaArab WorldArgentinaArmeniaArubaAzerbaijanBahamas, TheBahrainBangladeshBarbadosBelarusBelizeBeninBermudaBhutanBoliviaBosnia and HerzegovinaBotswanaBrazilBritish Virgin IslandsBrunei DarussalamBurkina FasoBurundiCabo VerdeCambodiaCameroonCaribbean small statesCayman IslandsCentral African RepublicCentral Europe and the BalticsChadChileChinaColombiaComorosCongo, Dem. Rep.Congo, Rep.Costa RicaCote d'IvoireCroatiaCubaCyprusDjiboutiDominicaDominican RepublicEast Asia & PacificEast Asia & Pacific (excluding high income)East Asia & Pacific (IDA & IBRD countries)EcuadorEgypt, Arab Rep.El SalvadorEquatorial GuineaEritreaEthiopiaEuro areaEurope & Central AsiaEurope & Central Asia (excluding high income)Europe & Central Asia (IDA & IBRD countries)European UnionFijiFragile and conflict affected situationsFrench PolynesiaGabonGambia, TheGeorgiaGhanaGibraltarGrenadaGuatemalaGuineaGuinea-BissauGuyanaHaitiHeavily indebted poor countries (HIPC)High incomeHondurasHong Kong SAR, ChinaIBRD onlyIDA & IBRD totalIDA blendIDA onlyIDA totalIndiaIndonesiaIran, Islamic Rep.IraqIsraelJamaicaJordanKazakhstanKenyaKiribatiKorea, Dem. People’s Rep.Korea, Rep.KosovoKuwaitKyrgyz RepublicLao PDRLatin America & Caribbean Latin America & Caribbean (excluding high income)Latin America & the Caribbean (IDA & IBRD countries)Least developed countries: UN classificationLebanonLesothoLiberiaLibyaLow & middle incomeLow incomeLower middle incomeMacao SAR, ChinaMacedonia, FYRMadagascarMalawiMalaysiaMaldivesMaliMaltaMarshall IslandsMauritaniaMauritiusMexicoMicronesia, Fed. Sts.Middle East & North AfricaMiddle East & North Africa (excluding high income)Middle East & North Africa (IDA & IBRD countries)Middle incomeMoldovaMongoliaMontenegroMoroccoMozambiqueMyanmarNamibiaNauruNepalNew CaledoniaNicaraguaNigerNigeriaNorth AmericaNorthern Mariana IslandsOECD membersOmanOther small statesPacific island small statesPakistanPalauPanamaPapua New GuineaParaguayPeruPhilippinesQatarRwandaSamoaSao Tome and PrincipeSaudi ArabiaSenegalSerbiaSeychellesSierra LeoneSingaporeSloveniaSmall statesSolomon IslandsSomaliaSouth AfricaSouth AsiaSouth Asia (IDA & IBRD)South SudanSri LankaSt. Kitts and NevisSt. LuciaSt. Vincent and the GrenadinesSub-Saharan Africa Sub-Saharan Africa (excluding high income)Sub-Saharan Africa (IDA & IBRD countries)SudanSurinameSwazilandSyrian Arab RepublicTajikistanTanzaniaThailandTimor-LesteTogoTongaTrinidad and TobagoTunisiaTurkeyTurkmenistanTurks and Caicos IslandsTuvaluUgandaUkraineUnited Arab EmiratesUpper middle incomeUruguayUzbekistanVanuatuVenezuela, RBVietnamWest Bank and GazaWorldYemen, Rep.ZambiaZimbabwe línea de tiempo (timeline):
En esta escala de tiempo se presenta un gráfico de 1965 y 1997 de Bermuda. Los datos de 1964 están ausentes. El número de observaciones reales por fecha: 31.
Fuente (nombre):
Indicadores del desarrollo mundial
Fuente (organización):
Development Assistance Committee of the Organisation for Economic Co-operation and Development, Geographical Distribution of Financial Flows to Developing Countries, Development Co-operation Report, and International Development Statistics database. Data are available online at: www.oecd.org/dac/stats/idsonline. World Bank population estimates are used for the denominator.
Categorías:
Aid Effectiveness, Economy & Growth, External Debt
Se ha actualizado:
23 abr 2017 año
Los indicadores de los cambios de valor en los últimos años
Mínimo:
-210.384
1 ene 1995 año
Máximo:
711.155
1 ene 1991 año
A la fecha de observación
Valor
Cambio absoluto
El cambio con respecto al valor anterior
1 ene 1965 año
0.204
+0.204
0.0%
1 ene 1966 año
0.998
+0.794
388.02%
1 ene 1967 año
1.176
+0.178
17.88%
1 ene 1968 año
1.154
-0.023
-1.92%
1 ene 1969 año
0.755
-0.399
-34.59%
1 ene 1970 año
0.185
-0.57
-75.46%
1 ene 1971 año
0.182
-0.003
-1.82%
1 ene 1973 año
0.185
+0.003
1.48%
1 ene 1975 año
0.562
+0.377
204.49%
1 ene 1976 año
0.377
-0.184
-32.83%
1 ene 1977 año
0.564
+0.187
49.44%
1 ene 1978 año
1.498
+0.934
165.67%
1 ene 1979 año
2.985
+1.487
99.25%
1 ene 1980 año
2.788
-0.197
-6.6%
1 ene 1981 año
5.122
+2.334
83.7%
1 ene 1982 año
3.815
-1.307
-25.52%
1 ene 1983 año
1.262
-2.552
-66.91%
1 ene 1984 año
1.252
-0.011
-0.86%
1 ene 1985 año
1.418
+0.166
13.29%
1 ene 1986 año
16.521
+15.103
1.07 mil%
1 ene 1987 año
1.568
-14.952
-90.51%
1 ene 1988 año
3.976
+2.407
153.49%
1 ene 1989 año
0.686
-3.29
-82.76%
1 ene 1990 año
1.699
+1.014
147.9%
1 ene 1991 año
711.155
+709.456
41.75 mil%
1 ene 1992 año
-79.972
-791.127
-111.25%
1 ene 1993 año
-85.332
-5.36
6.7%
1 ene 1994 año
-81.82
+3.512
-4.12%
1 ene 1995 año
-210.384
-128.565
157.13%
1 ene 1996 año
-34.814
+175.57
-83.45%
1 ene 1997 año
-67.688
-32.874
94.43%
Ranking de los países por los datos estadísticos actuales


Comentarios: