29
/es/
es
AIzaSyAYiBZKx7MnpbEhh9jyipgxe19OcubqV5w
April 1, 2024
24364
Arab World
ARB
false
2
1
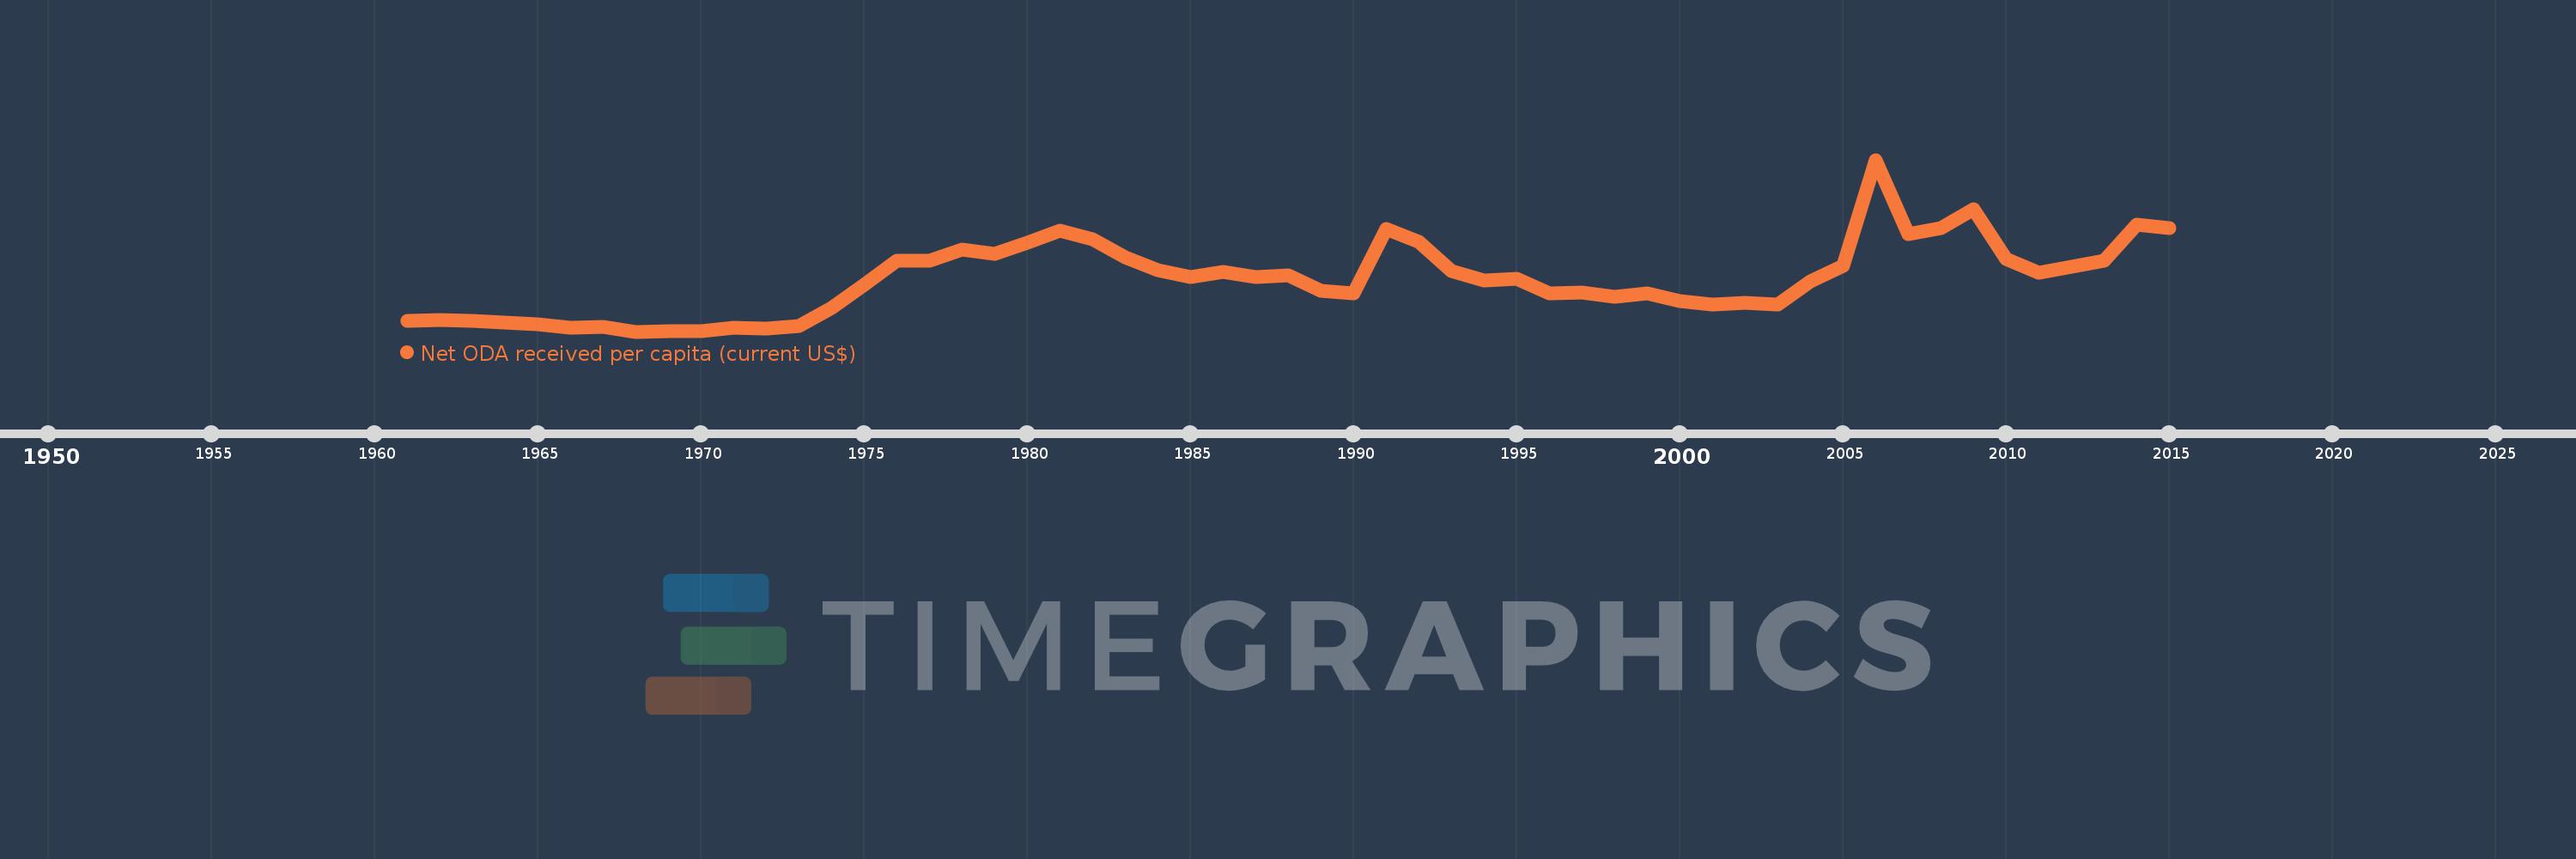
Net ODA received per capita (current US$)
2015,2014,2013,2012,2011,2010,2009,2008,2007,2006,2005,2004,2003,2002,2001,2000,1999,1998,1997,1996,1995,1994,1993,1992,1991,1990,1989,1988,1987,1986,1985,1984,1983,1982,1981,1980,1979,1978,1977,1976,1975,1974,1973,1972,1971,1970,1969,1968,1967,1966,1965,1964,1963,1962,1961
Estas estadísticas en otros países:
AfghanistanAlbaniaAlgeriaAngolaAntigua and BarbudaArab WorldArgentinaArmeniaArubaAzerbaijanBahamas, TheBahrainBangladeshBarbadosBelarusBelizeBeninBermudaBhutanBoliviaBosnia and HerzegovinaBotswanaBrazilBritish Virgin IslandsBrunei DarussalamBurkina FasoBurundiCabo VerdeCambodiaCameroonCaribbean small statesCayman IslandsCentral African RepublicCentral Europe and the BalticsChadChileChinaColombiaComorosCongo, Dem. Rep.Congo, Rep.Costa RicaCote d'IvoireCroatiaCubaCyprusDjiboutiDominicaDominican RepublicEast Asia & PacificEast Asia & Pacific (excluding high income)East Asia & Pacific (IDA & IBRD countries)EcuadorEgypt, Arab Rep.El SalvadorEquatorial GuineaEritreaEthiopiaEuro areaEurope & Central AsiaEurope & Central Asia (excluding high income)Europe & Central Asia (IDA & IBRD countries)European UnionFijiFragile and conflict affected situationsFrench PolynesiaGabonGambia, TheGeorgiaGhanaGibraltarGrenadaGuatemalaGuineaGuinea-BissauGuyanaHaitiHeavily indebted poor countries (HIPC)High incomeHondurasHong Kong SAR, ChinaIBRD onlyIDA & IBRD totalIDA blendIDA onlyIDA totalIndiaIndonesiaIran, Islamic Rep.IraqIsraelJamaicaJordanKazakhstanKenyaKiribatiKorea, Dem. People’s Rep.Korea, Rep.KosovoKuwaitKyrgyz RepublicLao PDRLatin America & Caribbean Latin America & Caribbean (excluding high income)Latin America & the Caribbean (IDA & IBRD countries)Least developed countries: UN classificationLebanonLesothoLiberiaLibyaLow & middle incomeLow incomeLower middle incomeMacao SAR, ChinaMacedonia, FYRMadagascarMalawiMalaysiaMaldivesMaliMaltaMarshall IslandsMauritaniaMauritiusMexicoMicronesia, Fed. Sts.Middle East & North AfricaMiddle East & North Africa (excluding high income)Middle East & North Africa (IDA & IBRD countries)Middle incomeMoldovaMongoliaMontenegroMoroccoMozambiqueMyanmarNamibiaNauruNepalNew CaledoniaNicaraguaNigerNigeriaNorth AmericaNorthern Mariana IslandsOECD membersOmanOther small statesPacific island small statesPakistanPalauPanamaPapua New GuineaParaguayPeruPhilippinesQatarRwandaSamoaSao Tome and PrincipeSaudi ArabiaSenegalSerbiaSeychellesSierra LeoneSingaporeSloveniaSmall statesSolomon IslandsSomaliaSouth AfricaSouth AsiaSouth Asia (IDA & IBRD)South SudanSri LankaSt. Kitts and NevisSt. LuciaSt. Vincent and the GrenadinesSub-Saharan Africa Sub-Saharan Africa (excluding high income)Sub-Saharan Africa (IDA & IBRD countries)SudanSurinameSwazilandSyrian Arab RepublicTajikistanTanzaniaThailandTimor-LesteTogoTongaTrinidad and TobagoTunisiaTurkeyTurkmenistanTurks and Caicos IslandsTuvaluUgandaUkraineUnited Arab EmiratesUpper middle incomeUruguayUzbekistanVanuatuVenezuela, RBVietnamWest Bank and GazaWorldYemen, Rep.ZambiaZimbabwe línea de tiempo (timeline):
En esta escala de tiempo se presenta un gráfico de 1961 y 2015 de Arab World. Los datos de 1960 están ausentes. El número de observaciones reales por fecha: 55.
Fuente (nombre):
Indicadores del desarrollo mundial
Fuente (organización):
Development Assistance Committee of the Organisation for Economic Co-operation and Development, Geographical Distribution of Financial Flows to Developing Countries, Development Co-operation Report, and International Development Statistics database. Data are available online at: www.oecd.org/dac/stats/idsonline. World Bank population estimates are used for the denominator.
Categorías:
Aid Effectiveness, Economy & Growth, External Debt
Se ha actualizado:
23 abr 2017 año
Los indicadores de los cambios de valor en los últimos años
Mínimo:
4.044
1 ene 1968 año
Máximo:
93.405
1 ene 2006 año
A la fecha de observación
Valor
Cambio absoluto
El cambio con respecto al valor anterior
1 ene 1961 año
9.531
+9.531
0.0%
1 ene 1962 año
10.243
+0.713
7.48%
1 ene 1963 año
9.509
-0.735
-7.17%
1 ene 1964 año
8.549
-0.96
-10.1%
1 ene 1965 año
8.051
-0.497
-5.82%
1 ene 1966 año
6.273
-1.779
-22.09%
1 ene 1967 año
6.302
+0.029
0.47%
1 ene 1968 año
4.044
-2.258
-35.84%
1 ene 1969 año
4.325
+0.281
6.96%
1 ene 1970 año
4.148
-0.177
-4.09%
1 ene 1971 año
5.842
+1.694
40.84%
1 ene 1972 año
5.825
-0.017
-0.29%
1 ene 1973 año
6.797
+0.972
16.68%
1 ene 1974 año
16.465
+9.668
142.23%
1 ene 1975 año
28.512
+12.047
73.17%
1 ene 1976 año
40.75
+12.238
42.92%
1 ene 1977 año
41.05
+0.301
0.74%
1 ene 1978 año
46.926
+5.875
14.31%
1 ene 1979 año
44.635
-2.291
-4.88%
1 ene 1980 año
50.476
+5.841
13.09%
1 ene 1981 año
56.33
+5.854
11.6%
1 ene 1982 año
52.225
-4.104
-7.29%
1 ene 1983 año
42.725
-9.501
-18.19%
1 ene 1984 año
35.86
-6.865
-16.07%
1 ene 1985 año
32.441
-3.419
-9.53%
1 ene 1986 año
35.174
+2.733
8.42%
1 ene 1987 año
32.465
-2.709
-7.7%
1 ene 1988 año
33.448
+0.983
3.03%
1 ene 1989 año
25.45
-7.998
-23.91%
1 ene 1990 año
23.933
-1.517
-5.96%
1 ene 1991 año
57.422
+33.489
139.93%
1 ene 1992 año
50.555
-6.867
-11.96%
1 ene 1993 año
35.723
-14.831
-29.34%
1 ene 1994 año
30.728
-4.995
-13.98%
1 ene 1995 año
31.314
+0.586
1.91%
1 ene 1996 año
23.818
-7.496
-23.94%
1 ene 1997 año
24.504
+0.686
2.88%
1 ene 1998 año
22.251
-2.252
-9.19%
1 ene 1999 año
23.939
+1.688
7.59%
1 ene 2000 año
19.926
-4.013
-16.76%
1 ene 2001 año
17.913
-2.013
-10.1%
1 ene 2002 año
18.966
+1.053
5.88%
1 ene 2003 año
18.035
-0.93
-4.9%
1 ene 2004 año
30.22
+12.184
67.56%
1 ene 2005 año
38.21
+7.991
26.44%
1 ene 2006 año
93.405
+55.194
144.45%
1 ene 2007 año
54.699
-38.706
-41.44%
1 ene 2008 año
57.968
+3.269
5.98%
1 ene 2009 año
67.554
+9.586
16.54%
1 ene 2010 año
41.618
-25.936
-38.39%
1 ene 2011 año
34.858
-6.761
-16.24%
1 ene 2012 año
37.744
+2.887
8.28%
1 ene 2013 año
40.829
+3.084
8.17%
1 ene 2014 año
59.688
+18.859
46.19%
1 ene 2015 año
57.989
-1.699
-2.85%
Ranking de los países por los datos estadísticos actuales


Comentarios: