29
/es/
es
AIzaSyAYiBZKx7MnpbEhh9jyipgxe19OcubqV5w
April 1, 2024
281376
Venezuela, RB
VEN
true
2
1
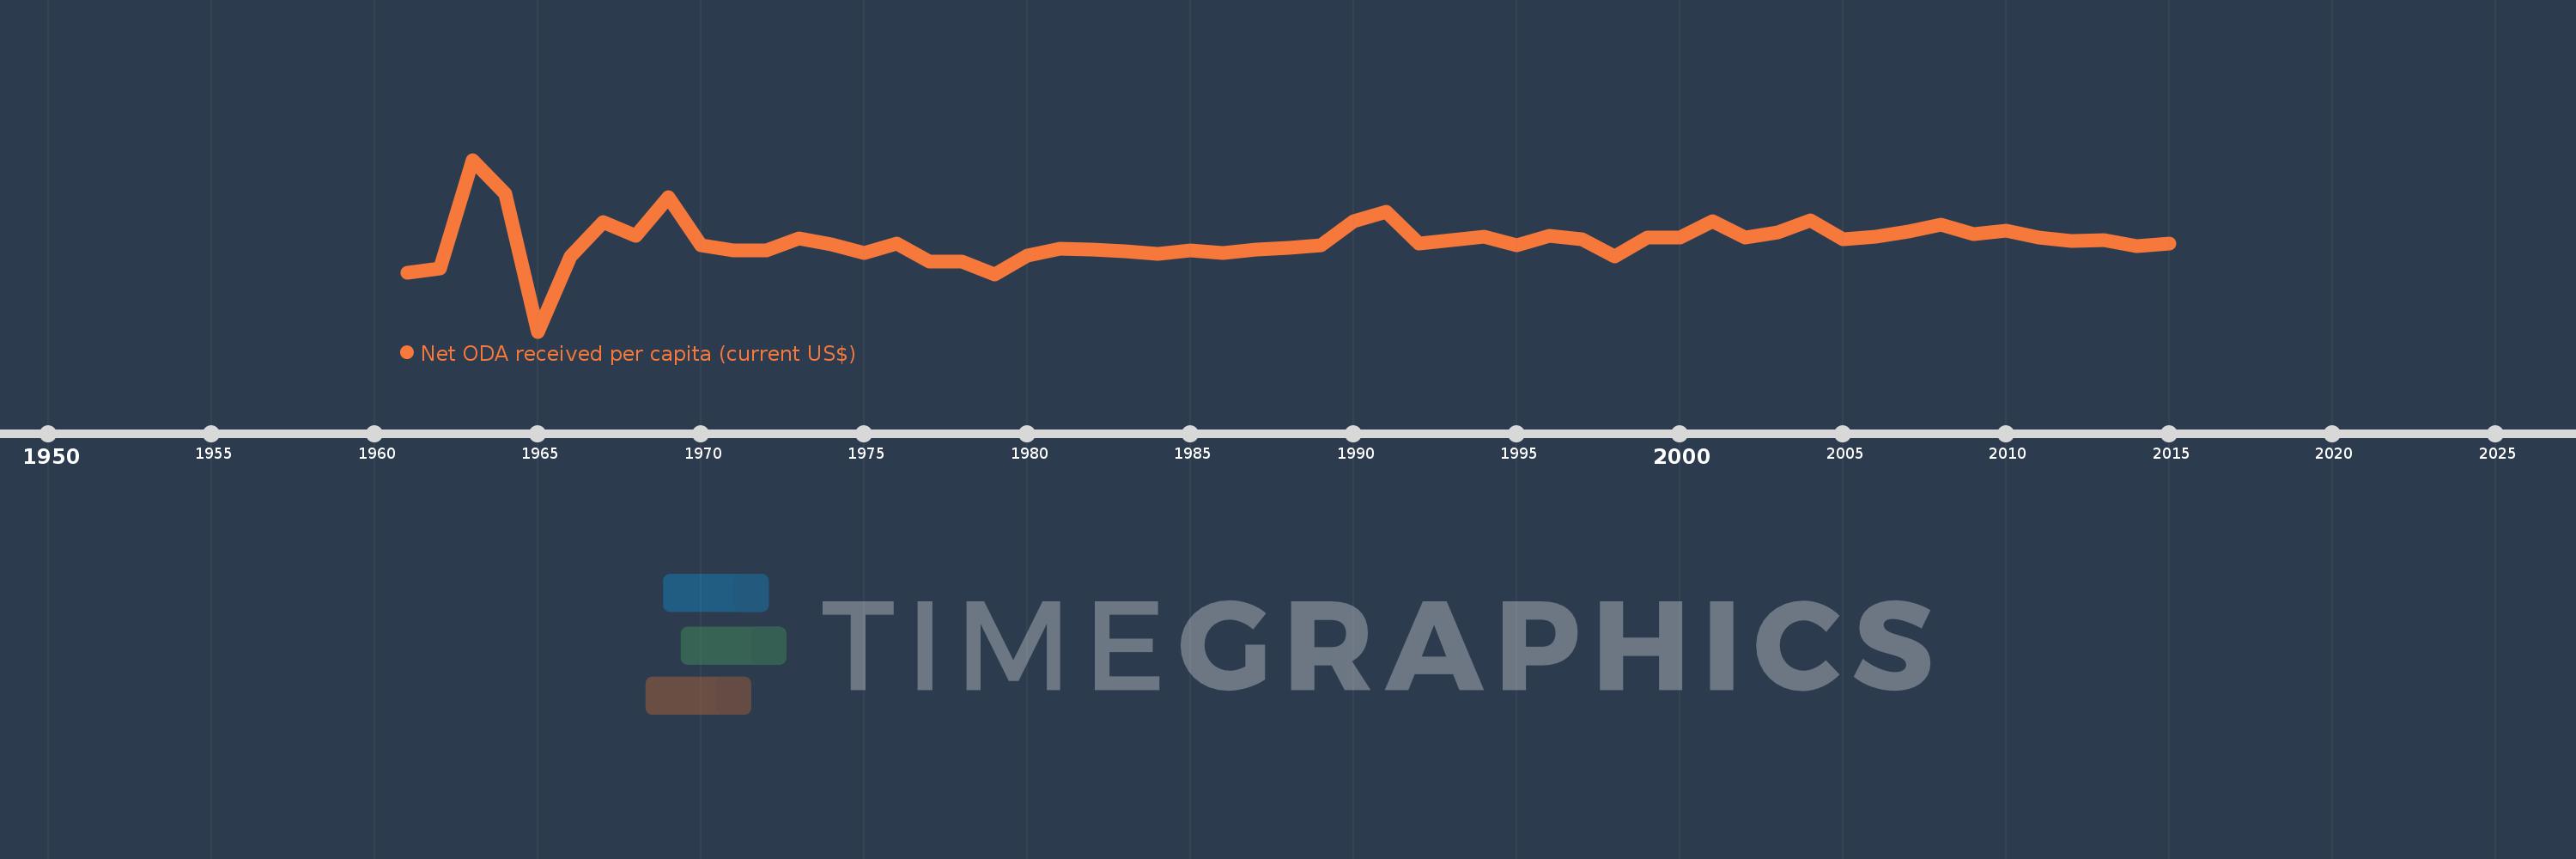
Net ODA received per capita (current US$)
2015,2014,2013,2012,2011,2010,2009,2008,2007,2006,2005,2004,2003,2002,2001,2000,1999,1998,1997,1996,1995,1994,1993,1992,1991,1990,1989,1988,1987,1986,1985,1984,1983,1982,1981,1980,1979,1978,1977,1976,1975,1974,1973,1972,1971,1970,1969,1968,1967,1966,1965,1964,1963,1962,1961
Estas estadísticas en otros países:
AfghanistanAlbaniaAlgeriaAngolaAntigua and BarbudaArab WorldArgentinaArmeniaArubaAzerbaijanBahamas, TheBahrainBangladeshBarbadosBelarusBelizeBeninBermudaBhutanBoliviaBosnia and HerzegovinaBotswanaBrazilBritish Virgin IslandsBrunei DarussalamBurkina FasoBurundiCabo VerdeCambodiaCameroonCaribbean small statesCayman IslandsCentral African RepublicCentral Europe and the BalticsChadChileChinaColombiaComorosCongo, Dem. Rep.Congo, Rep.Costa RicaCote d'IvoireCroatiaCubaCyprusDjiboutiDominicaDominican RepublicEast Asia & PacificEast Asia & Pacific (excluding high income)East Asia & Pacific (IDA & IBRD countries)EcuadorEgypt, Arab Rep.El SalvadorEquatorial GuineaEritreaEthiopiaEuro areaEurope & Central AsiaEurope & Central Asia (excluding high income)Europe & Central Asia (IDA & IBRD countries)European UnionFijiFragile and conflict affected situationsFrench PolynesiaGabonGambia, TheGeorgiaGhanaGibraltarGrenadaGuatemalaGuineaGuinea-BissauGuyanaHaitiHeavily indebted poor countries (HIPC)High incomeHondurasHong Kong SAR, ChinaIBRD onlyIDA & IBRD totalIDA blendIDA onlyIDA totalIndiaIndonesiaIran, Islamic Rep.IraqIsraelJamaicaJordanKazakhstanKenyaKiribatiKorea, Dem. People’s Rep.Korea, Rep.KosovoKuwaitKyrgyz RepublicLao PDRLatin America & Caribbean Latin America & Caribbean (excluding high income)Latin America & the Caribbean (IDA & IBRD countries)Least developed countries: UN classificationLebanonLesothoLiberiaLibyaLow & middle incomeLow incomeLower middle incomeMacao SAR, ChinaMacedonia, FYRMadagascarMalawiMalaysiaMaldivesMaliMaltaMarshall IslandsMauritaniaMauritiusMexicoMicronesia, Fed. Sts.Middle East & North AfricaMiddle East & North Africa (excluding high income)Middle East & North Africa (IDA & IBRD countries)Middle incomeMoldovaMongoliaMontenegroMoroccoMozambiqueMyanmarNamibiaNauruNepalNew CaledoniaNicaraguaNigerNigeriaNorth AmericaNorthern Mariana IslandsOECD membersOmanOther small statesPacific island small statesPakistanPalauPanamaPapua New GuineaParaguayPeruPhilippinesQatarRwandaSamoaSao Tome and PrincipeSaudi ArabiaSenegalSerbiaSeychellesSierra LeoneSingaporeSloveniaSmall statesSolomon IslandsSomaliaSouth AfricaSouth AsiaSouth Asia (IDA & IBRD)South SudanSri LankaSt. Kitts and NevisSt. LuciaSt. Vincent and the GrenadinesSub-Saharan Africa Sub-Saharan Africa (excluding high income)Sub-Saharan Africa (IDA & IBRD countries)SudanSurinameSwazilandSyrian Arab RepublicTajikistanTanzaniaThailandTimor-LesteTogoTongaTrinidad and TobagoTunisiaTurkeyTurkmenistanTurks and Caicos IslandsTuvaluUgandaUkraineUnited Arab EmiratesUpper middle incomeUruguayUzbekistanVanuatuVenezuela, RBVietnamWest Bank and GazaWorldYemen, Rep.ZambiaZimbabwe línea de tiempo (timeline):
En esta escala de tiempo se presenta un gráfico de 1961 y 2015 de Venezuela, RB. Los datos de 1960 están ausentes. El número de observaciones reales por fecha: 55.
Fuente (nombre):
Indicadores del desarrollo mundial
Fuente (organización):
Development Assistance Committee of the Organisation for Economic Co-operation and Development, Geographical Distribution of Financial Flows to Developing Countries, Development Co-operation Report, and International Development Statistics database. Data are available online at: www.oecd.org/dac/stats/idsonline. World Bank population estimates are used for the denominator.
Categorías:
Aid Effectiveness, Economy & Growth, External Debt
Se ha actualizado:
23 abr 2017 año
Los indicadores de los cambios de valor en los últimos años
Mínimo:
-5.456
1 ene 1965 año
Máximo:
7.837
1 ene 1963 año
A la fecha de observación
Valor
Cambio absoluto
El cambio con respecto al valor anterior
1 ene 1961 año
-0.919
-0.919
0.0%
1 ene 1962 año
-0.577
+0.343
-37.27%
1 ene 1963 año
7.837
+8.414
-1.46 mil%
1 ene 1964 año
5.227
-2.61
-33.31%
1 ene 1965 año
-5.456
-10.682
-204.39%
1 ene 1966 año
0.387
+5.843
-107.09%
1 ene 1967 año
2.995
+2.608
674.23%
1 ene 1968 año
1.95
-1.045
-34.88%
1 ene 1969 año
4.963
+3.013
154.52%
1 ene 1970 año
1.245
-3.718
-74.91%
1 ene 1971 año
0.846
-0.399
-32.08%
1 ene 1972 año
0.855
+0.01
1.13%
1 ene 1973 año
1.73
+0.874
102.22%
1 ene 1974 año
1.257
-0.473
-27.34%
1 ene 1975 año
0.603
-0.654
-52.05%
1 ene 1976 año
1.359
+0.757
125.56%
1 ene 1977 año
-0.036
-1.396
-102.68%
1 ene 1978 año
-0.016
+0.02
-55.27%
1 ene 1979 año
-1.017
-1.001
6.15 mil%
1 ene 1980 año
0.437
+1.453
-142.94%
1 ene 1981 año
0.989
+0.553
126.57%
1 ene 1982 año
0.873
-0.116
-11.76%
1 ene 1983 año
0.763
-0.11
-12.6%
1 ene 1984 año
0.57
-0.193
-25.31%
1 ene 1985 año
0.825
+0.255
44.74%
1 ene 1986 año
0.636
-0.189
-22.86%
1 ene 1987 año
0.887
+0.251
39.42%
1 ene 1988 año
0.994
+0.107
12.07%
1 ene 1989 año
1.2
+0.206
20.68%
1 ene 1990 año
3.084
+1.885
157.08%
1 ene 1991 año
3.845
+0.76
24.65%
1 ene 1992 año
1.383
-2.462
-64.04%
1 ene 1993 año
1.605
+0.223
16.12%
1 ene 1994 año
1.916
+0.311
19.38%
1 ene 1995 año
1.206
-0.711
-37.08%
1 ene 1996 año
1.952
+0.746
61.9%
1 ene 1997 año
1.668
-0.284
-14.56%
1 ene 1998 año
0.386
-1.282
-76.86%
1 ene 1999 año
1.794
+1.408
364.78%
1 ene 2000 año
1.841
+0.047
2.62%
1 ene 2001 año
3.107
+1.266
68.75%
1 ene 2002 año
1.791
-1.315
-42.34%
1 ene 2003 año
2.226
+0.434
24.24%
1 ene 2004 año
3.137
+0.911
40.94%
1 ene 2005 año
1.707
-1.43
-45.59%
1 ene 2006 año
1.879
+0.172
10.1%
1 ene 2007 año
2.312
+0.433
23.03%
1 ene 2008 año
2.81
+0.498
21.56%
1 ene 2009 año
2.106
-0.704
-25.05%
1 ene 2010 año
2.323
+0.217
10.29%
1 ene 2011 año
1.813
-0.51
-21.95%
1 ene 2012 año
1.579
-0.234
-12.9%
1 ene 2013 año
1.61
+0.031
1.94%
1 ene 2014 año
1.161
-0.449
-27.86%
1 ene 2015 año
1.324
+0.162
13.98%
Ranking de los países por los datos estadísticos actuales


Comentarios: