29
/es/
es
AIzaSyAYiBZKx7MnpbEhh9jyipgxe19OcubqV5w
April 1, 2024
120204
Djibouti
DJI
true
2
1
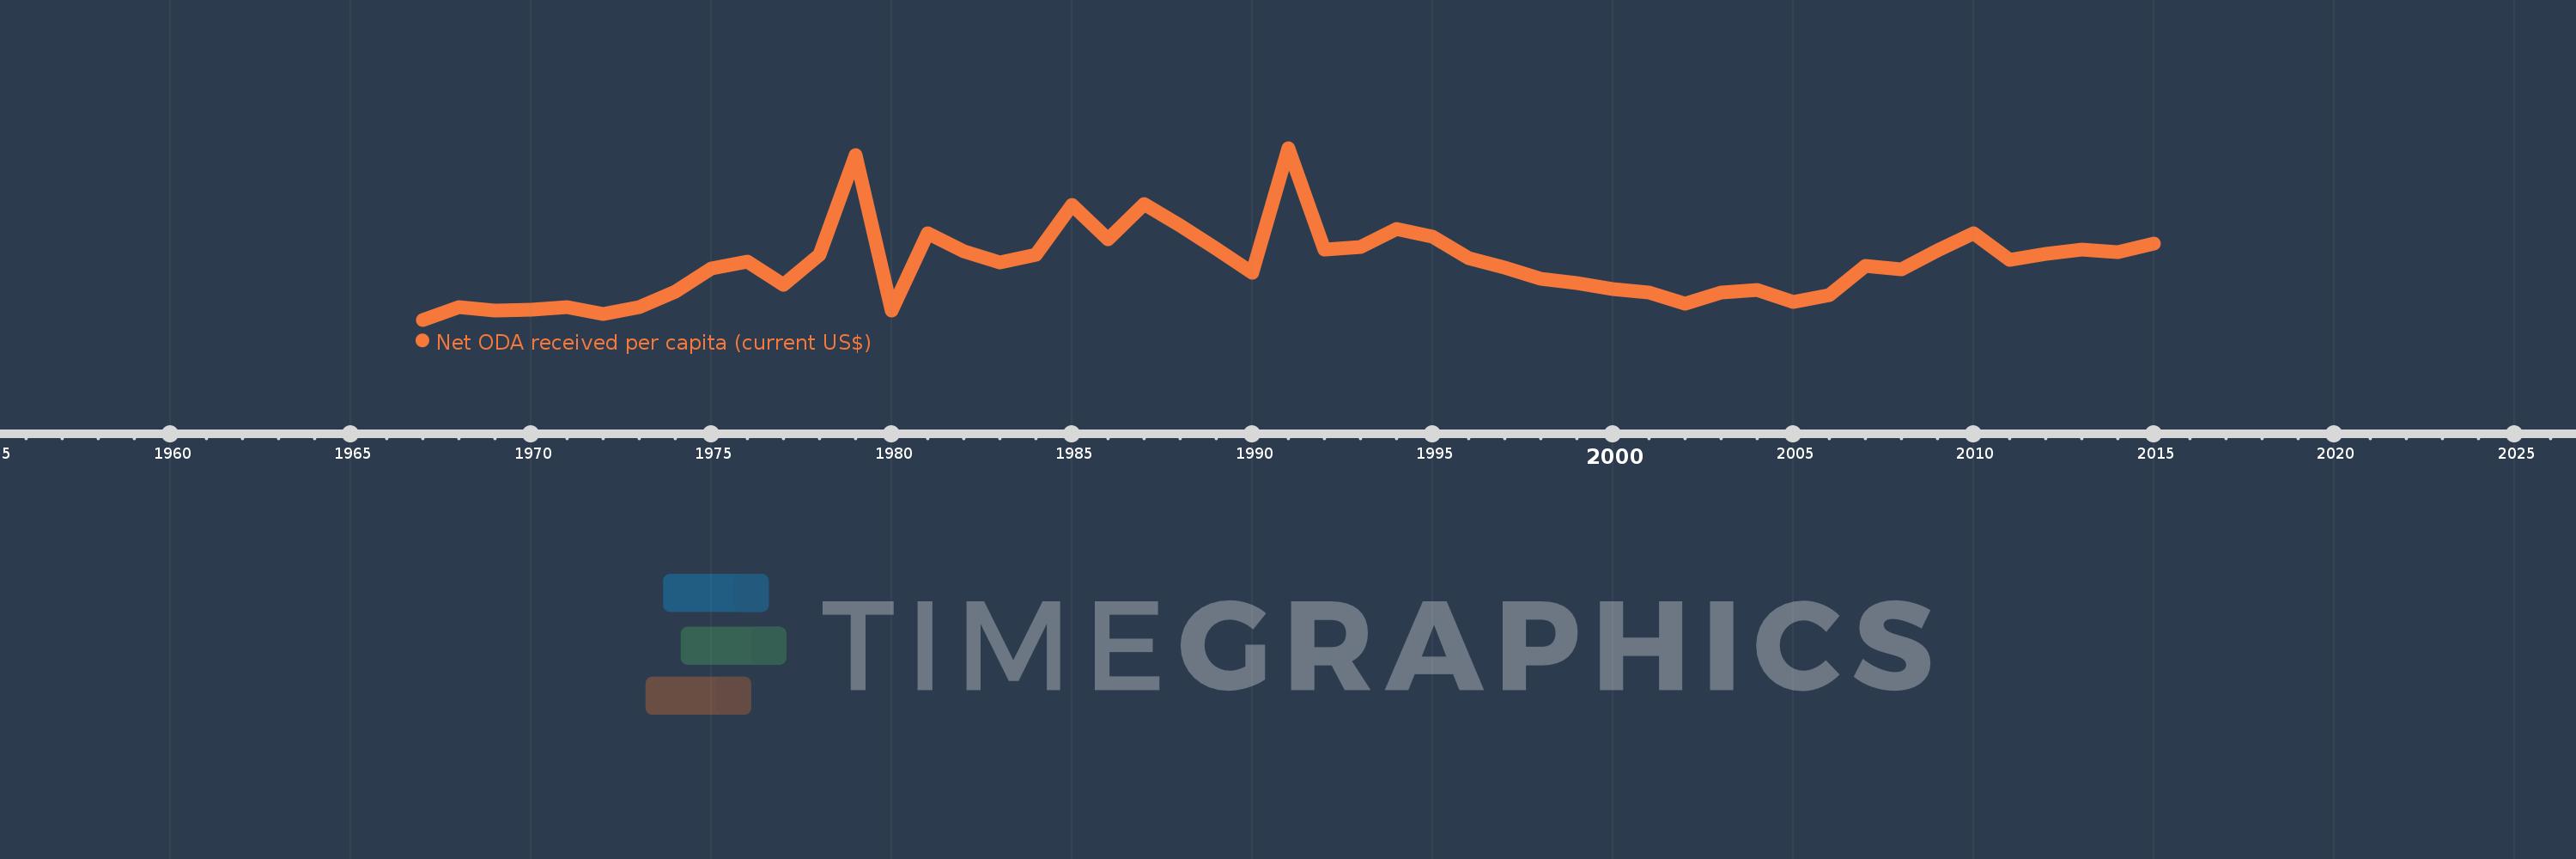
Net ODA received per capita (current US$)
2015,2014,2013,2012,2011,2010,2009,2008,2007,2006,2005,2004,2003,2002,2001,2000,1999,1998,1997,1996,1995,1994,1993,1992,1991,1990,1989,1988,1987,1986,1985,1984,1983,1982,1981,1980,1979,1978,1977,1976,1975,1974,1973,1972,1971,1970,1969,1968,1967
Estas estadísticas en otros países:
AfghanistanAlbaniaAlgeriaAngolaAntigua and BarbudaArab WorldArgentinaArmeniaArubaAzerbaijanBahamas, TheBahrainBangladeshBarbadosBelarusBelizeBeninBermudaBhutanBoliviaBosnia and HerzegovinaBotswanaBrazilBritish Virgin IslandsBrunei DarussalamBurkina FasoBurundiCabo VerdeCambodiaCameroonCaribbean small statesCayman IslandsCentral African RepublicCentral Europe and the BalticsChadChileChinaColombiaComorosCongo, Dem. Rep.Congo, Rep.Costa RicaCote d'IvoireCroatiaCubaCyprusDjiboutiDominicaDominican RepublicEast Asia & PacificEast Asia & Pacific (excluding high income)East Asia & Pacific (IDA & IBRD countries)EcuadorEgypt, Arab Rep.El SalvadorEquatorial GuineaEritreaEthiopiaEuro areaEurope & Central AsiaEurope & Central Asia (excluding high income)Europe & Central Asia (IDA & IBRD countries)European UnionFijiFragile and conflict affected situationsFrench PolynesiaGabonGambia, TheGeorgiaGhanaGibraltarGrenadaGuatemalaGuineaGuinea-BissauGuyanaHaitiHeavily indebted poor countries (HIPC)High incomeHondurasHong Kong SAR, ChinaIBRD onlyIDA & IBRD totalIDA blendIDA onlyIDA totalIndiaIndonesiaIran, Islamic Rep.IraqIsraelJamaicaJordanKazakhstanKenyaKiribatiKorea, Dem. People’s Rep.Korea, Rep.KosovoKuwaitKyrgyz RepublicLao PDRLatin America & Caribbean Latin America & Caribbean (excluding high income)Latin America & the Caribbean (IDA & IBRD countries)Least developed countries: UN classificationLebanonLesothoLiberiaLibyaLow & middle incomeLow incomeLower middle incomeMacao SAR, ChinaMacedonia, FYRMadagascarMalawiMalaysiaMaldivesMaliMaltaMarshall IslandsMauritaniaMauritiusMexicoMicronesia, Fed. Sts.Middle East & North AfricaMiddle East & North Africa (excluding high income)Middle East & North Africa (IDA & IBRD countries)Middle incomeMoldovaMongoliaMontenegroMoroccoMozambiqueMyanmarNamibiaNauruNepalNew CaledoniaNicaraguaNigerNigeriaNorth AmericaNorthern Mariana IslandsOECD membersOmanOther small statesPacific island small statesPakistanPalauPanamaPapua New GuineaParaguayPeruPhilippinesQatarRwandaSamoaSao Tome and PrincipeSaudi ArabiaSenegalSerbiaSeychellesSierra LeoneSingaporeSloveniaSmall statesSolomon IslandsSomaliaSouth AfricaSouth AsiaSouth Asia (IDA & IBRD)South SudanSri LankaSt. Kitts and NevisSt. LuciaSt. Vincent and the GrenadinesSub-Saharan Africa Sub-Saharan Africa (excluding high income)Sub-Saharan Africa (IDA & IBRD countries)SudanSurinameSwazilandSyrian Arab RepublicTajikistanTanzaniaThailandTimor-LesteTogoTongaTrinidad and TobagoTunisiaTurkeyTurkmenistanTurks and Caicos IslandsTuvaluUgandaUkraineUnited Arab EmiratesUpper middle incomeUruguayUzbekistanVanuatuVenezuela, RBVietnamWest Bank and GazaWorldYemen, Rep.ZambiaZimbabwe línea de tiempo (timeline):
En esta escala de tiempo se presenta un gráfico de 1967 y 2015 de Djibouti. Los datos de 1966 están ausentes. El número de observaciones reales por fecha: 49.
Fuente (nombre):
Indicadores del desarrollo mundial
Fuente (organización):
Development Assistance Committee of the Organisation for Economic Co-operation and Development, Geographical Distribution of Financial Flows to Developing Countries, Development Co-operation Report, and International Development Statistics database. Data are available online at: www.oecd.org/dac/stats/idsonline. World Bank population estimates are used for the denominator.
Categorías:
Aid Effectiveness, Economy & Growth, External Debt
Se ha actualizado:
23 abr 2017 año
Los indicadores de los cambios de valor en los últimos años
Mínimo:
52.658
1 ene 1967 año
Máximo:
351.845
1 ene 1991 año
A la fecha de observación
Valor
Cambio absoluto
El cambio con respecto al valor anterior
1 ene 1967 año
52.658
+52.658
0.0%
1 ene 1968 año
74.199
+21.541
40.91%
1 ene 1969 año
69.13
-5.07
-6.83%
1 ene 1970 año
70.184
+1.055
1.53%
1 ene 1971 año
74.092
+3.907
5.57%
1 ene 1972 año
62.88
-11.212
-15.13%
1 ene 1973 año
74.493
+11.613
18.47%
1 ene 1974 año
102.238
+27.745
37.25%
1 ene 1975 año
141.648
+39.41
38.55%
1 ene 1976 año
153.447
+11.799
8.33%
1 ene 1977 año
113.145
-40.302
-26.26%
1 ene 1978 año
166.521
+53.376
47.18%
1 ene 1979 año
338.727
+172.205
103.41%
1 ene 1980 año
68.936
-269.791
-79.65%
1 ene 1981 año
203.477
+134.541
195.17%
1 ene 1982 año
172.172
-31.305
-15.38%
1 ene 1983 año
152.881
-19.291
-11.2%
1 ene 1984 año
166.528
+13.646
8.93%
1 ene 1985 año
252.33
+85.803
51.52%
1 ene 1986 año
192.198
-60.132
-23.83%
1 ene 1987 año
254.795
+62.597
32.57%
1 ene 1988 año
216.861
-37.935
-14.89%
1 ene 1989 año
176.965
-39.895
-18.4%
1 ene 1990 año
134.25
-42.716
-24.14%
1 ene 1991 año
351.845
+217.595
162.08%
1 ene 1992 año
175.477
-176.368
-50.13%
1 ene 1993 año
178.913
+3.437
1.96%
1 ene 1994 año
210.305
+31.391
17.55%
1 ene 1995 año
197.837
-12.468
-5.93%
1 ene 1996 año
159.392
-38.445
-19.43%
1 ene 1997 año
143.924
-15.468
-9.7%
1 ene 1998 año
124.642
-19.282
-13.4%
1 ene 1999 año
115.975
-8.667
-6.95%
1 ene 2000 año
105.607
-10.367
-8.94%
1 ene 2001 año
99.839
-5.768
-5.46%
1 ene 2002 año
80.781
-19.059
-19.09%
1 ene 2003 año
99.402
+18.621
23.05%
1 ene 2004 año
105.081
+5.679
5.71%
1 ene 2005 año
83.554
-21.526
-20.49%
1 ene 2006 año
95.22
+11.666
13.96%
1 ene 2007 año
146.082
+50.862
53.41%
1 ene 2008 año
140.884
-5.198
-3.56%
1 ene 2009 año
173.929
+33.045
23.46%
1 ene 2010 año
203.281
+29.351
16.88%
1 ene 2011 año
157.667
-45.614
-22.44%
1 ene 2012 año
166.939
+9.273
5.88%
1 ene 2013 año
174.148
+7.208
4.32%
1 ene 2014 año
170.955
-3.192
-1.83%
1 ene 2015 año
185.568
+14.613
8.55%
Ranking de los países por los datos estadísticos actuales


Comentarios: