29
/es/
es
AIzaSyAYiBZKx7MnpbEhh9jyipgxe19OcubqV5w
April 1, 2024
185582
Madagascar
MDG
true
2
1
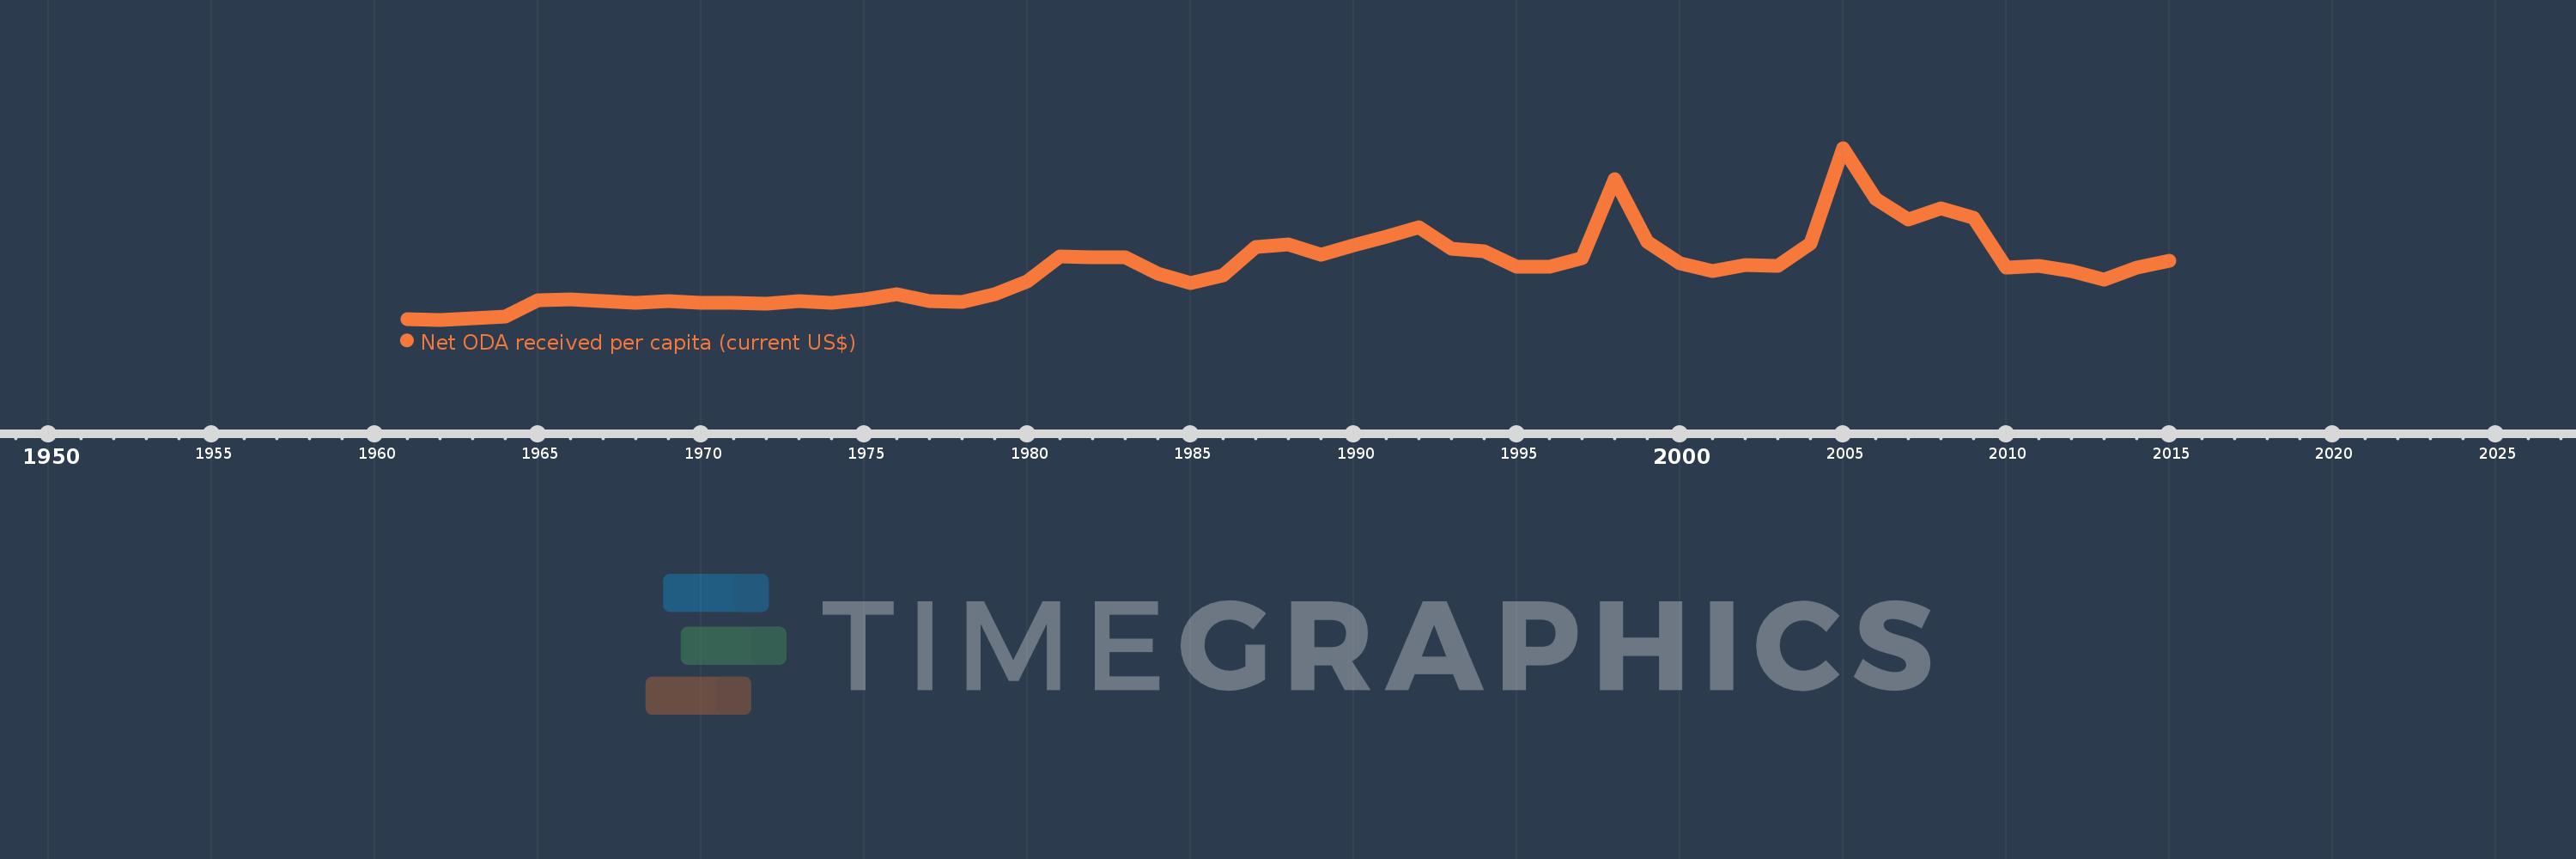
Net ODA received per capita (current US$)
2015,2014,2013,2012,2011,2010,2009,2008,2007,2006,2005,2004,2003,2002,2001,2000,1999,1998,1997,1996,1995,1994,1993,1992,1991,1990,1989,1988,1987,1986,1985,1984,1983,1982,1981,1980,1979,1978,1977,1976,1975,1974,1973,1972,1971,1970,1969,1968,1967,1966,1965,1964,1963,1962,1961
Estas estadísticas en otros países:
AfghanistanAlbaniaAlgeriaAngolaAntigua and BarbudaArab WorldArgentinaArmeniaArubaAzerbaijanBahamas, TheBahrainBangladeshBarbadosBelarusBelizeBeninBermudaBhutanBoliviaBosnia and HerzegovinaBotswanaBrazilBritish Virgin IslandsBrunei DarussalamBurkina FasoBurundiCabo VerdeCambodiaCameroonCaribbean small statesCayman IslandsCentral African RepublicCentral Europe and the BalticsChadChileChinaColombiaComorosCongo, Dem. Rep.Congo, Rep.Costa RicaCote d'IvoireCroatiaCubaCyprusDjiboutiDominicaDominican RepublicEast Asia & PacificEast Asia & Pacific (excluding high income)East Asia & Pacific (IDA & IBRD countries)EcuadorEgypt, Arab Rep.El SalvadorEquatorial GuineaEritreaEthiopiaEuro areaEurope & Central AsiaEurope & Central Asia (excluding high income)Europe & Central Asia (IDA & IBRD countries)European UnionFijiFragile and conflict affected situationsFrench PolynesiaGabonGambia, TheGeorgiaGhanaGibraltarGrenadaGuatemalaGuineaGuinea-BissauGuyanaHaitiHeavily indebted poor countries (HIPC)High incomeHondurasHong Kong SAR, ChinaIBRD onlyIDA & IBRD totalIDA blendIDA onlyIDA totalIndiaIndonesiaIran, Islamic Rep.IraqIsraelJamaicaJordanKazakhstanKenyaKiribatiKorea, Dem. People’s Rep.Korea, Rep.KosovoKuwaitKyrgyz RepublicLao PDRLatin America & Caribbean Latin America & Caribbean (excluding high income)Latin America & the Caribbean (IDA & IBRD countries)Least developed countries: UN classificationLebanonLesothoLiberiaLibyaLow & middle incomeLow incomeLower middle incomeMacao SAR, ChinaMacedonia, FYRMadagascarMalawiMalaysiaMaldivesMaliMaltaMarshall IslandsMauritaniaMauritiusMexicoMicronesia, Fed. Sts.Middle East & North AfricaMiddle East & North Africa (excluding high income)Middle East & North Africa (IDA & IBRD countries)Middle incomeMoldovaMongoliaMontenegroMoroccoMozambiqueMyanmarNamibiaNauruNepalNew CaledoniaNicaraguaNigerNigeriaNorth AmericaNorthern Mariana IslandsOECD membersOmanOther small statesPacific island small statesPakistanPalauPanamaPapua New GuineaParaguayPeruPhilippinesQatarRwandaSamoaSao Tome and PrincipeSaudi ArabiaSenegalSerbiaSeychellesSierra LeoneSingaporeSloveniaSmall statesSolomon IslandsSomaliaSouth AfricaSouth AsiaSouth Asia (IDA & IBRD)South SudanSri LankaSt. Kitts and NevisSt. LuciaSt. Vincent and the GrenadinesSub-Saharan Africa Sub-Saharan Africa (excluding high income)Sub-Saharan Africa (IDA & IBRD countries)SudanSurinameSwazilandSyrian Arab RepublicTajikistanTanzaniaThailandTimor-LesteTogoTongaTrinidad and TobagoTunisiaTurkeyTurkmenistanTurks and Caicos IslandsTuvaluUgandaUkraineUnited Arab EmiratesUpper middle incomeUruguayUzbekistanVanuatuVenezuela, RBVietnamWest Bank and GazaWorldYemen, Rep.ZambiaZimbabwe línea de tiempo (timeline):
En esta escala de tiempo se presenta un gráfico de 1961 y 2015 de Madagascar. Los datos de 1960 están ausentes. El número de observaciones reales por fecha: 55.
Fuente (nombre):
Indicadores del desarrollo mundial
Fuente (organización):
Development Assistance Committee of the Organisation for Economic Co-operation and Development, Geographical Distribution of Financial Flows to Developing Countries, Development Co-operation Report, and International Development Statistics database. Data are available online at: www.oecd.org/dac/stats/idsonline. World Bank population estimates are used for the denominator.
Categorías:
Aid Effectiveness, Economy & Growth, External Debt
Se ha actualizado:
23 abr 2017 año
Los indicadores de los cambios de valor en los últimos años
Mínimo:
0.285
1 ene 1962 año
Máximo:
71.087
1 ene 2005 año
A la fecha de observación
Valor
Cambio absoluto
El cambio con respecto al valor anterior
1 ene 1961 año
0.52
+0.52
0.0%
1 ene 1962 año
0.285
-0.234
-45.11%
1 ene 1963 año
0.932
+0.647
226.82%
1 ene 1964 año
1.511
+0.579
62.08%
1 ene 1965 año
8.46
+6.949
459.9%
1 ene 1966 año
8.809
+0.349
4.13%
1 ene 1967 año
8.06
-0.749
-8.5%
1 ene 1968 año
7.187
-0.873
-10.83%
1 ene 1969 año
7.801
+0.614
8.54%
1 ene 1970 año
7.12
-0.681
-8.73%
1 ene 1971 año
7.291
+0.172
2.41%
1 ene 1972 año
6.935
-0.357
-4.89%
1 ene 1973 año
7.868
+0.933
13.46%
1 ene 1974 año
7.34
-0.528
-6.71%
1 ene 1975 año
8.526
+1.185
16.15%
1 ene 1976 año
10.852
+2.326
27.29%
1 ene 1977 año
7.866
-2.986
-27.52%
1 ene 1978 año
7.543
-0.323
-4.11%
1 ene 1979 año
10.941
+3.398
45.05%
1 ene 1980 año
16.113
+5.172
47.27%
1 ene 1981 año
26.245
+10.132
62.88%
1 ene 1982 año
25.934
-0.311
-1.18%
1 ene 1983 año
26.041
+0.107
0.41%
1 ene 1984 año
19.147
-6.894
-26.47%
1 ene 1985 año
15.463
-3.685
-19.24%
1 ene 1986 año
18.499
+3.036
19.64%
1 ene 1987 año
30.184
+11.685
63.17%
1 ene 1988 año
31.296
+1.111
3.68%
1 ene 1989 año
27.21
-4.086
-13.06%
1 ene 1990 año
30.987
+3.778
13.88%
1 ene 1991 año
34.381
+3.394
10.95%
1 ene 1992 año
38.25
+3.869
11.25%
1 ene 1993 año
29.481
-8.769
-22.93%
1 ene 1994 año
28.569
-0.912
-3.09%
1 ene 1995 año
22.097
-6.472
-22.65%
1 ene 1996 año
22.257
+0.16
0.72%
1 ene 1997 año
25.549
+3.292
14.79%
1 ene 1998 año
58.133
+32.584
127.53%
1 ene 1999 año
32.488
-25.645
-44.11%
1 ene 2000 año
23.462
-9.025
-27.78%
1 ene 2001 año
20.337
-3.125
-13.32%
1 ene 2002 año
22.805
+2.468
12.13%
1 ene 2003 año
22.345
-0.46
-2.02%
1 ene 2004 año
31.68
+9.335
41.78%
1 ene 2005 año
71.087
+39.407
124.39%
1 ene 2006 año
49.918
-21.169
-29.78%
1 ene 2007 año
41.516
-8.402
-16.83%
1 ene 2008 año
46.155
+4.639
11.17%
1 ene 2009 año
42.282
-3.873
-8.39%
1 ene 2010 año
21.661
-20.621
-48.77%
1 ene 2011 año
22.401
+0.74
3.42%
1 ene 2012 año
20.505
-1.897
-8.47%
1 ene 2013 año
16.833
-3.672
-17.91%
1 ene 2014 año
21.771
+4.938
29.33%
1 ene 2015 año
24.739
+2.968
13.64%
Ranking de los países por los datos estadísticos actuales


Comentarios: