29
/es/
es
AIzaSyAYiBZKx7MnpbEhh9jyipgxe19OcubqV5w
April 1, 2024
151866
Hong Kong SAR, China
HKG
true
2
1
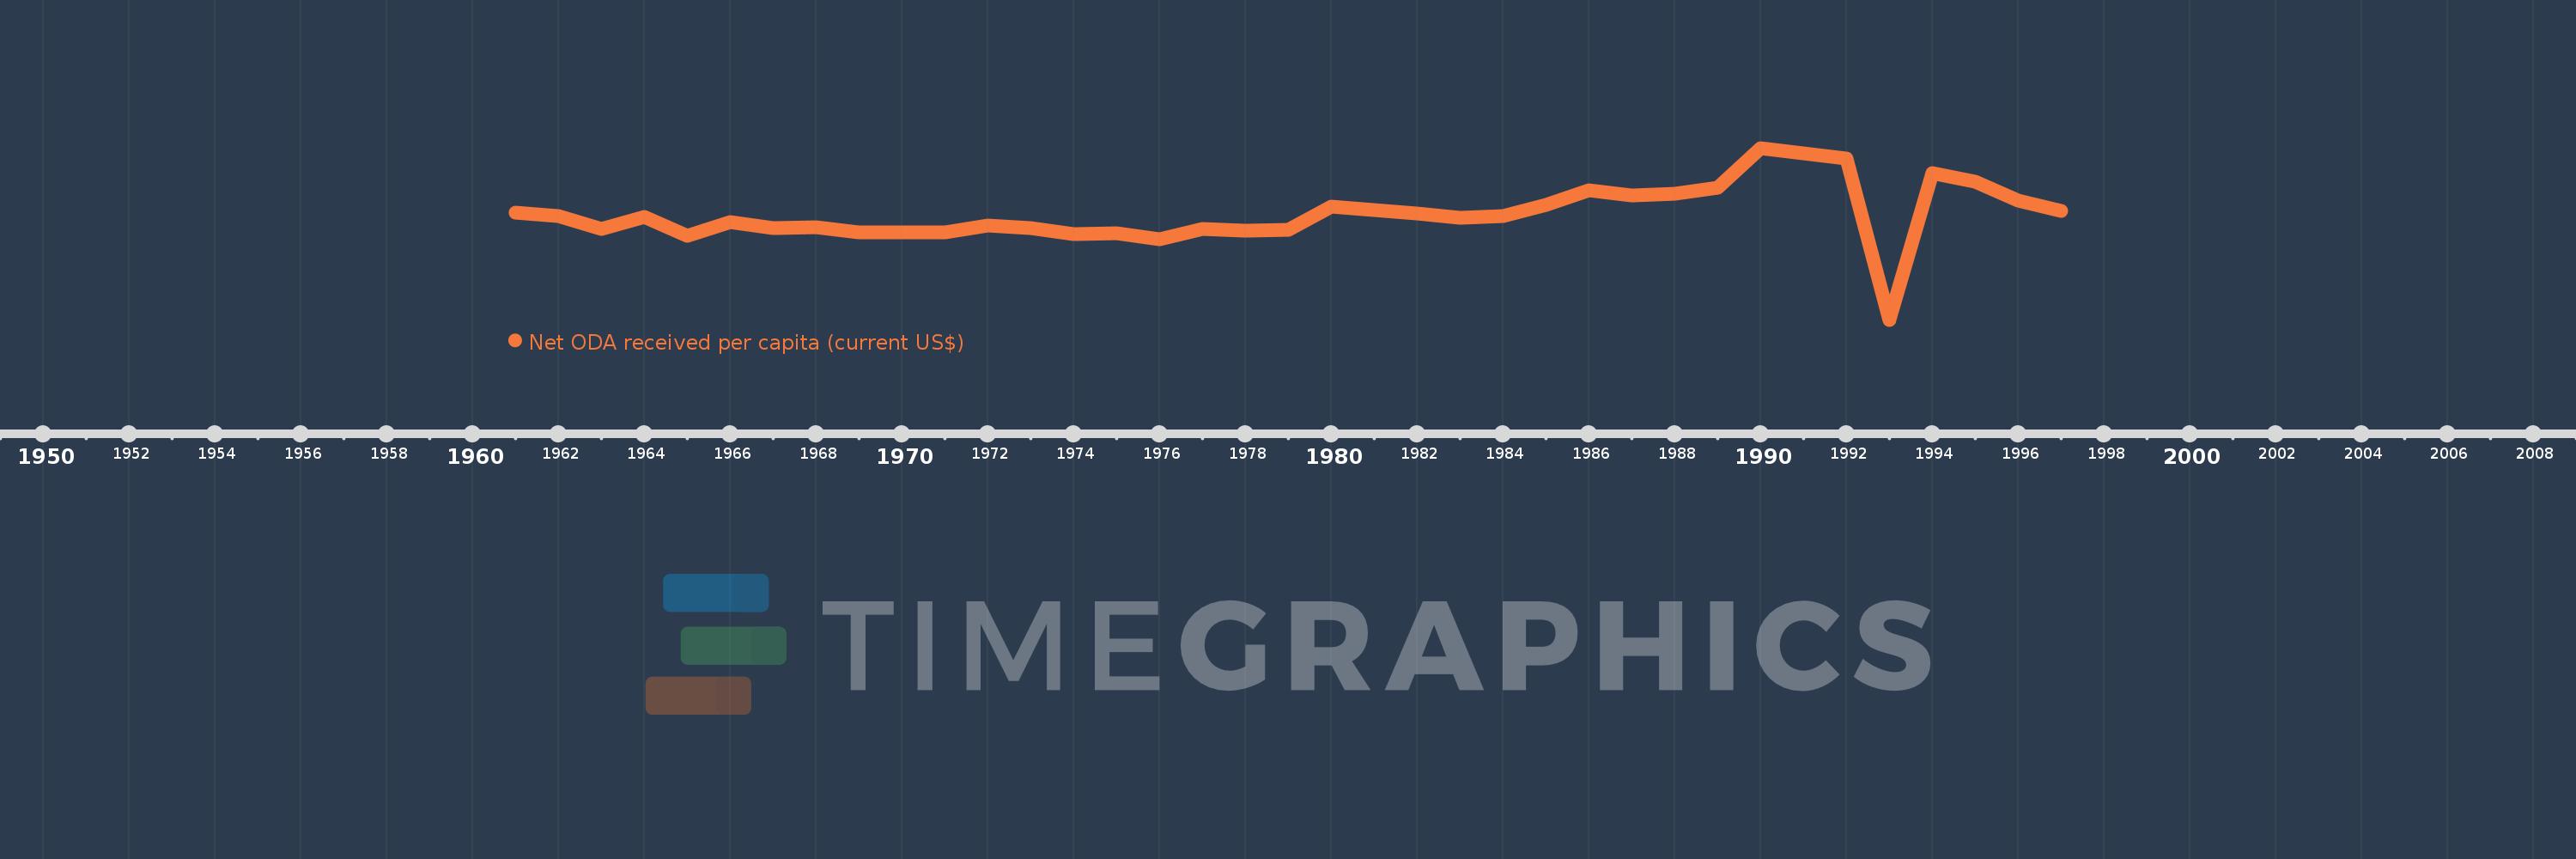
Net ODA received per capita (current US$)
1997,1996,1995,1994,1993,1992,1991,1990,1989,1988,1987,1986,1985,1984,1983,1982,1981,1980,1979,1978,1977,1976,1975,1974,1973,1972,1971,1970,1969,1968,1967,1966,1965,1964,1963,1962,1961
Estas estadísticas en otros países:
AfghanistanAlbaniaAlgeriaAngolaAntigua and BarbudaArab WorldArgentinaArmeniaArubaAzerbaijanBahamas, TheBahrainBangladeshBarbadosBelarusBelizeBeninBermudaBhutanBoliviaBosnia and HerzegovinaBotswanaBrazilBritish Virgin IslandsBrunei DarussalamBurkina FasoBurundiCabo VerdeCambodiaCameroonCaribbean small statesCayman IslandsCentral African RepublicCentral Europe and the BalticsChadChileChinaColombiaComorosCongo, Dem. Rep.Congo, Rep.Costa RicaCote d'IvoireCroatiaCubaCyprusDjiboutiDominicaDominican RepublicEast Asia & PacificEast Asia & Pacific (excluding high income)East Asia & Pacific (IDA & IBRD countries)EcuadorEgypt, Arab Rep.El SalvadorEquatorial GuineaEritreaEthiopiaEuro areaEurope & Central AsiaEurope & Central Asia (excluding high income)Europe & Central Asia (IDA & IBRD countries)European UnionFijiFragile and conflict affected situationsFrench PolynesiaGabonGambia, TheGeorgiaGhanaGibraltarGrenadaGuatemalaGuineaGuinea-BissauGuyanaHaitiHeavily indebted poor countries (HIPC)High incomeHondurasHong Kong SAR, ChinaIBRD onlyIDA & IBRD totalIDA blendIDA onlyIDA totalIndiaIndonesiaIran, Islamic Rep.IraqIsraelJamaicaJordanKazakhstanKenyaKiribatiKorea, Dem. People’s Rep.Korea, Rep.KosovoKuwaitKyrgyz RepublicLao PDRLatin America & Caribbean Latin America & Caribbean (excluding high income)Latin America & the Caribbean (IDA & IBRD countries)Least developed countries: UN classificationLebanonLesothoLiberiaLibyaLow & middle incomeLow incomeLower middle incomeMacao SAR, ChinaMacedonia, FYRMadagascarMalawiMalaysiaMaldivesMaliMaltaMarshall IslandsMauritaniaMauritiusMexicoMicronesia, Fed. Sts.Middle East & North AfricaMiddle East & North Africa (excluding high income)Middle East & North Africa (IDA & IBRD countries)Middle incomeMoldovaMongoliaMontenegroMoroccoMozambiqueMyanmarNamibiaNauruNepalNew CaledoniaNicaraguaNigerNigeriaNorth AmericaNorthern Mariana IslandsOECD membersOmanOther small statesPacific island small statesPakistanPalauPanamaPapua New GuineaParaguayPeruPhilippinesQatarRwandaSamoaSao Tome and PrincipeSaudi ArabiaSenegalSerbiaSeychellesSierra LeoneSingaporeSloveniaSmall statesSolomon IslandsSomaliaSouth AfricaSouth AsiaSouth Asia (IDA & IBRD)South SudanSri LankaSt. Kitts and NevisSt. LuciaSt. Vincent and the GrenadinesSub-Saharan Africa Sub-Saharan Africa (excluding high income)Sub-Saharan Africa (IDA & IBRD countries)SudanSurinameSwazilandSyrian Arab RepublicTajikistanTanzaniaThailandTimor-LesteTogoTongaTrinidad and TobagoTunisiaTurkeyTurkmenistanTurks and Caicos IslandsTuvaluUgandaUkraineUnited Arab EmiratesUpper middle incomeUruguayUzbekistanVanuatuVenezuela, RBVietnamWest Bank and GazaWorldYemen, Rep.ZambiaZimbabwe línea de tiempo (timeline):
En esta escala de tiempo se presenta un gráfico de 1961 y 1997 de Hong Kong SAR, China. Los datos de 1960 están ausentes. El número de observaciones reales por fecha: 37.
Fuente (nombre):
Indicadores del desarrollo mundial
Fuente (organización):
Development Assistance Committee of the Organisation for Economic Co-operation and Development, Geographical Distribution of Financial Flows to Developing Countries, Development Co-operation Report, and International Development Statistics database. Data are available online at: www.oecd.org/dac/stats/idsonline. World Bank population estimates are used for the denominator.
Categorías:
Aid Effectiveness, Economy & Growth, External Debt
Se ha actualizado:
23 abr 2017 año
Los indicadores de los cambios de valor en los últimos años
Mínimo:
-6.724
1 ene 1993 año
Máximo:
7.144
1 ene 1990 año
A la fecha de observación
Valor
Cambio absoluto
El cambio con respecto al valor anterior
1 ene 1961 año
1.896
+1.896
0.0%
1 ene 1962 año
1.616
-0.279
-14.74%
1 ene 1963 año
0.578
-1.038
-64.24%
1 ene 1964 año
1.593
+1.015
175.69%
1 ene 1965 año
0.08
-1.513
-94.99%
1 ene 1966 año
1.181
+1.101
1.38 mil%
1 ene 1967 año
0.68
-0.501
-42.39%
1 ene 1968 año
0.712
+0.031
4.61%
1 ene 1969 año
0.347
-0.365
-51.24%
1 ene 1970 año
0.334
-0.013
-3.82%
1 ene 1971 año
0.356
+0.022
6.68%
1 ene 1972 año
0.897
+0.541
151.95%
1 ene 1973 año
0.701
-0.196
-21.9%
1 ene 1974 año
0.215
-0.486
-69.39%
1 ene 1975 año
0.238
+0.023
10.77%
1 ene 1976 año
-0.256
-0.493
-207.52%
1 ene 1977 año
0.593
+0.849
-332.15%
1 ene 1978 año
0.452
-0.142
-23.87%
1 ene 1979 año
0.503
+0.052
11.49%
1 ene 1980 año
2.416
+1.912
379.85%
1 ene 1981 año
2.151
-0.265
-10.97%
1 ene 1982 año
1.837
-0.314
-14.61%
1 ene 1983 año
1.506
-0.33
-17.98%
1 ene 1984 año
1.643
+0.136
9.05%
1 ene 1985 año
2.547
+0.905
55.07%
1 ene 1986 año
3.754
+1.206
47.35%
1 ene 1987 año
3.343
-0.41
-10.93%
1 ene 1988 año
3.468
+0.125
3.74%
1 ene 1989 año
3.927
+0.459
13.22%
1 ene 1990 año
7.144
+3.217
81.91%
1 ene 1991 año
6.689
-0.454
-6.36%
1 ene 1992 año
6.271
-0.419
-6.26%
1 ene 1993 año
-6.724
-12.994
-207.22%
1 ene 1994 año
5.13
+11.853
-176.29%
1 ene 1995 año
4.452
-0.678
-13.21%
1 ene 1996 año
2.88
-1.572
-35.31%
1 ene 1997 año
2.051
-0.829
-28.78%
Ranking de los países por los datos estadísticos actuales


Comentarios: