29
/es/
es
AIzaSyAYiBZKx7MnpbEhh9jyipgxe19OcubqV5w
April 1, 2024
227709
Qatar
QAT
true
2
1
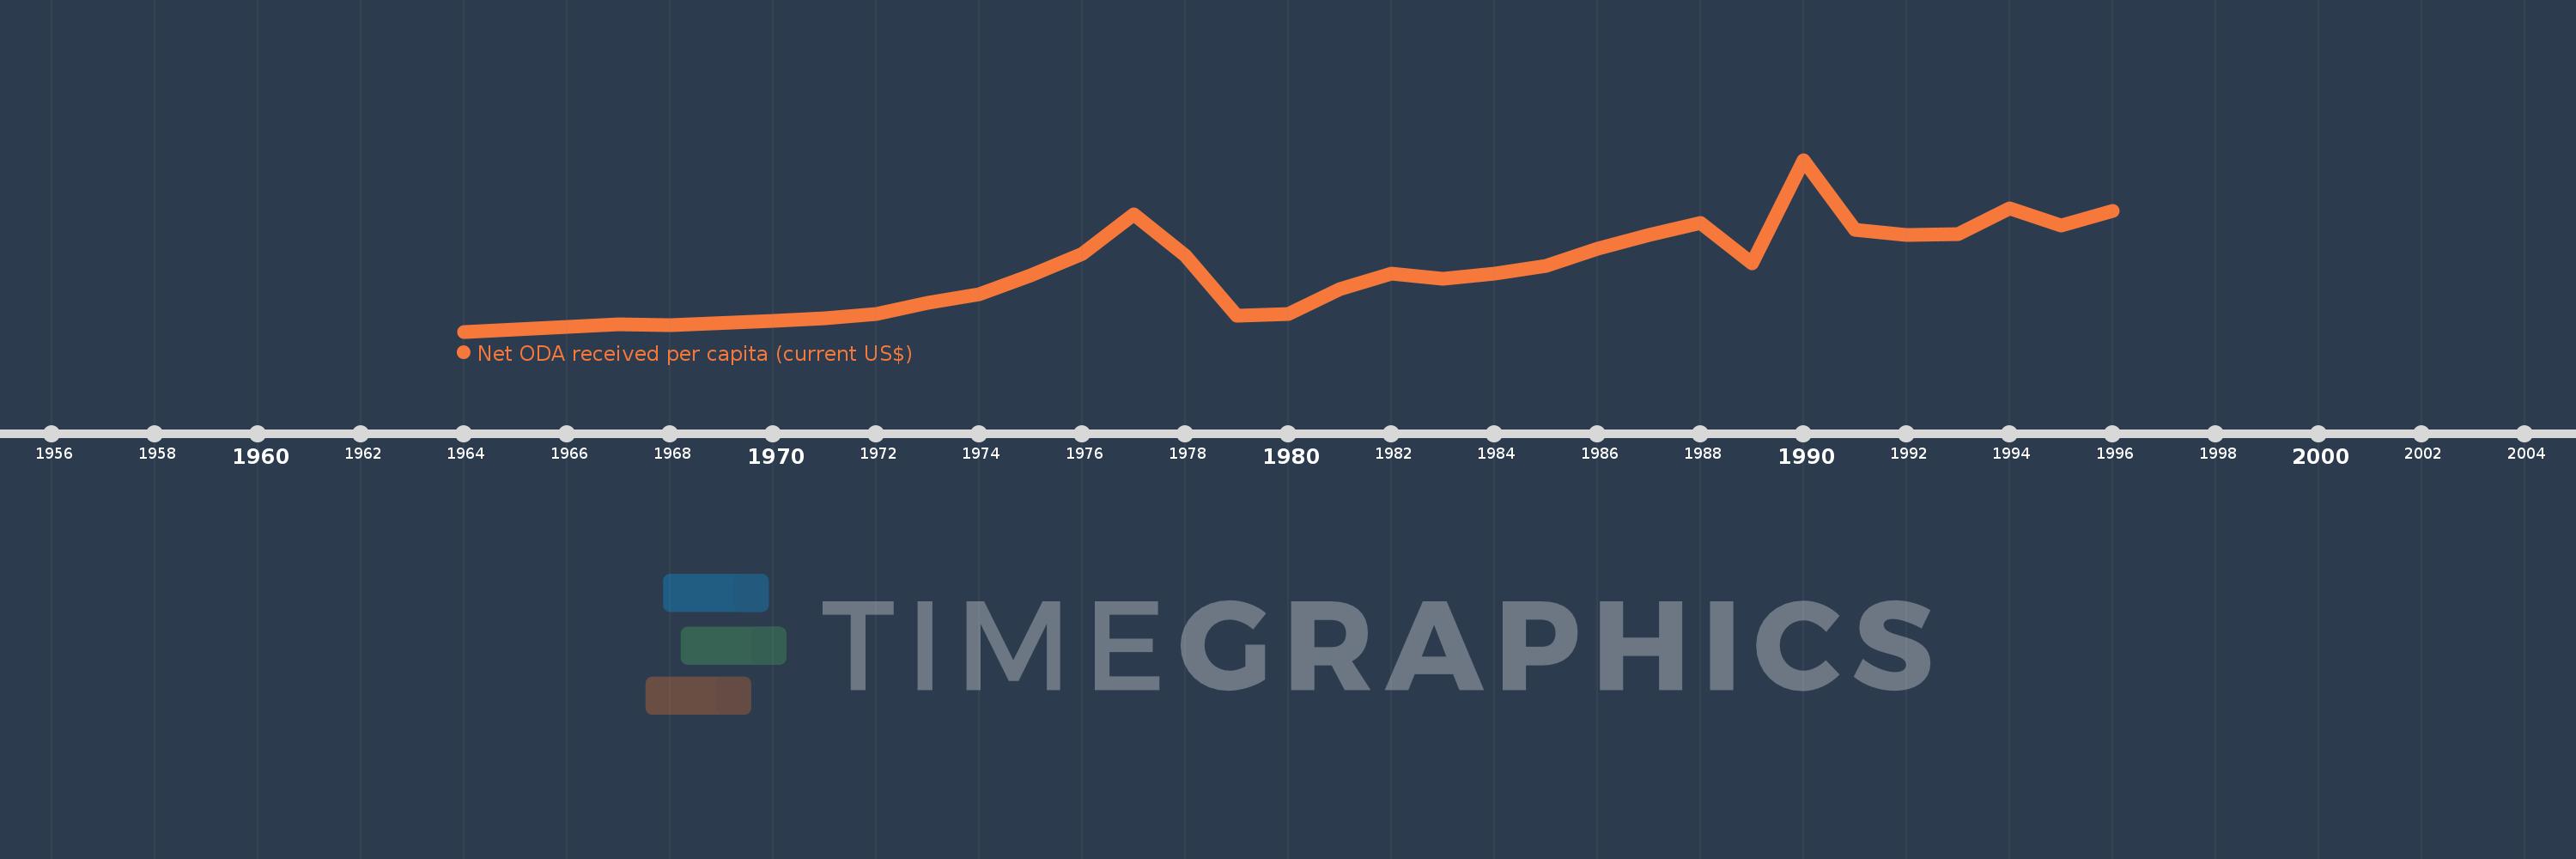
Net ODA received per capita (current US$)
1996,1995,1994,1993,1992,1991,1990,1989,1988,1987,1986,1985,1984,1983,1982,1981,1980,1979,1978,1977,1976,1975,1974,1973,1972,1971,1970,1968,1967,1964
Estas estadísticas en otros países:
AfghanistanAlbaniaAlgeriaAngolaAntigua and BarbudaArab WorldArgentinaArmeniaArubaAzerbaijanBahamas, TheBahrainBangladeshBarbadosBelarusBelizeBeninBermudaBhutanBoliviaBosnia and HerzegovinaBotswanaBrazilBritish Virgin IslandsBrunei DarussalamBurkina FasoBurundiCabo VerdeCambodiaCameroonCaribbean small statesCayman IslandsCentral African RepublicCentral Europe and the BalticsChadChileChinaColombiaComorosCongo, Dem. Rep.Congo, Rep.Costa RicaCote d'IvoireCroatiaCubaCyprusDjiboutiDominicaDominican RepublicEast Asia & PacificEast Asia & Pacific (excluding high income)East Asia & Pacific (IDA & IBRD countries)EcuadorEgypt, Arab Rep.El SalvadorEquatorial GuineaEritreaEthiopiaEuro areaEurope & Central AsiaEurope & Central Asia (excluding high income)Europe & Central Asia (IDA & IBRD countries)European UnionFijiFragile and conflict affected situationsFrench PolynesiaGabonGambia, TheGeorgiaGhanaGibraltarGrenadaGuatemalaGuineaGuinea-BissauGuyanaHaitiHeavily indebted poor countries (HIPC)High incomeHondurasHong Kong SAR, ChinaIBRD onlyIDA & IBRD totalIDA blendIDA onlyIDA totalIndiaIndonesiaIran, Islamic Rep.IraqIsraelJamaicaJordanKazakhstanKenyaKiribatiKorea, Dem. People’s Rep.Korea, Rep.KosovoKuwaitKyrgyz RepublicLao PDRLatin America & Caribbean Latin America & Caribbean (excluding high income)Latin America & the Caribbean (IDA & IBRD countries)Least developed countries: UN classificationLebanonLesothoLiberiaLibyaLow & middle incomeLow incomeLower middle incomeMacao SAR, ChinaMacedonia, FYRMadagascarMalawiMalaysiaMaldivesMaliMaltaMarshall IslandsMauritaniaMauritiusMexicoMicronesia, Fed. Sts.Middle East & North AfricaMiddle East & North Africa (excluding high income)Middle East & North Africa (IDA & IBRD countries)Middle incomeMoldovaMongoliaMontenegroMoroccoMozambiqueMyanmarNamibiaNauruNepalNew CaledoniaNicaraguaNigerNigeriaNorth AmericaNorthern Mariana IslandsOECD membersOmanOther small statesPacific island small statesPakistanPalauPanamaPapua New GuineaParaguayPeruPhilippinesQatarRwandaSamoaSao Tome and PrincipeSaudi ArabiaSenegalSerbiaSeychellesSierra LeoneSingaporeSloveniaSmall statesSolomon IslandsSomaliaSouth AfricaSouth AsiaSouth Asia (IDA & IBRD)South SudanSri LankaSt. Kitts and NevisSt. LuciaSt. Vincent and the GrenadinesSub-Saharan Africa Sub-Saharan Africa (excluding high income)Sub-Saharan Africa (IDA & IBRD countries)SudanSurinameSwazilandSyrian Arab RepublicTajikistanTanzaniaThailandTimor-LesteTogoTongaTrinidad and TobagoTunisiaTurkeyTurkmenistanTurks and Caicos IslandsTuvaluUgandaUkraineUnited Arab EmiratesUpper middle incomeUruguayUzbekistanVanuatuVenezuela, RBVietnamWest Bank and GazaWorldYemen, Rep.ZambiaZimbabwe línea de tiempo (timeline):
En esta escala de tiempo se presenta un gráfico de 1964 y 1996 de Qatar. Los datos de 1963 están ausentes. El número de observaciones reales por fecha: 30.
Fuente (nombre):
Indicadores del desarrollo mundial
Fuente (organización):
Development Assistance Committee of the Organisation for Economic Co-operation and Development, Geographical Distribution of Financial Flows to Developing Countries, Development Co-operation Report, and International Development Statistics database. Data are available online at: www.oecd.org/dac/stats/idsonline. World Bank population estimates are used for the denominator.
Categorías:
Aid Effectiveness, Economy & Growth, External Debt
Se ha actualizado:
23 abr 2017 año
Los indicadores de los cambios de valor en los últimos años
Mínimo:
-0.324
1 ene 1964 año
Máximo:
10.776
1 ene 1990 año
A la fecha de observación
Valor
Cambio absoluto
El cambio con respecto al valor anterior
1 ene 1964 año
-0.324
-0.324
0.0%
1 ene 1967 año
0.125
+0.45
-138.66%
1 ene 1968 año
0.116
-0.009
-7.46%
1 ene 1970 año
0.397
+0.281
242.26%
1 ene 1971 año
0.549
+0.152
38.16%
1 ene 1972 año
0.839
+0.29
52.81%
1 ene 1973 año
1.534
+0.695
82.92%
1 ene 1974 año
2.111
+0.577
37.61%
1 ene 1975 año
3.32
+1.209
57.29%
1 ene 1976 año
4.686
+1.365
41.11%
1 ene 1977 año
7.251
+2.566
54.76%
1 ene 1978 año
4.606
-2.645
-36.48%
1 ene 1979 año
0.729
-3.877
-84.17%
1 ene 1980 año
0.828
+0.099
13.6%
1 ene 1981 año
2.414
+1.586
191.42%
1 ene 1982 año
3.427
+1.013
41.96%
1 ene 1983 año
3.102
-0.325
-9.48%
1 ene 1984 año
3.395
+0.293
9.45%
1 ene 1985 año
3.897
+0.502
14.79%
1 ene 1986 año
5.013
+1.115
28.62%
1 ene 1987 año
5.9
+0.887
17.7%
1 ene 1988 año
6.685
+0.785
13.31%
1 ene 1989 año
4.11
-2.575
-38.51%
1 ene 1990 año
10.776
+6.666
162.16%
1 ene 1991 año
6.233
-4.543
-42.16%
1 ene 1992 año
5.937
-0.296
-4.76%
1 ene 1993 año
5.963
+0.026
0.45%
1 ene 1994 año
7.661
+1.698
28.47%
1 ene 1995 año
6.503
-1.158
-15.12%
1 ene 1996 año
7.465
+0.962
14.8%
Ranking de los países por los datos estadísticos actuales


Comentarios: