29
/es/
es
AIzaSyAYiBZKx7MnpbEhh9jyipgxe19OcubqV5w
April 1, 2024
116088
Cuba
CUB
true
2
1
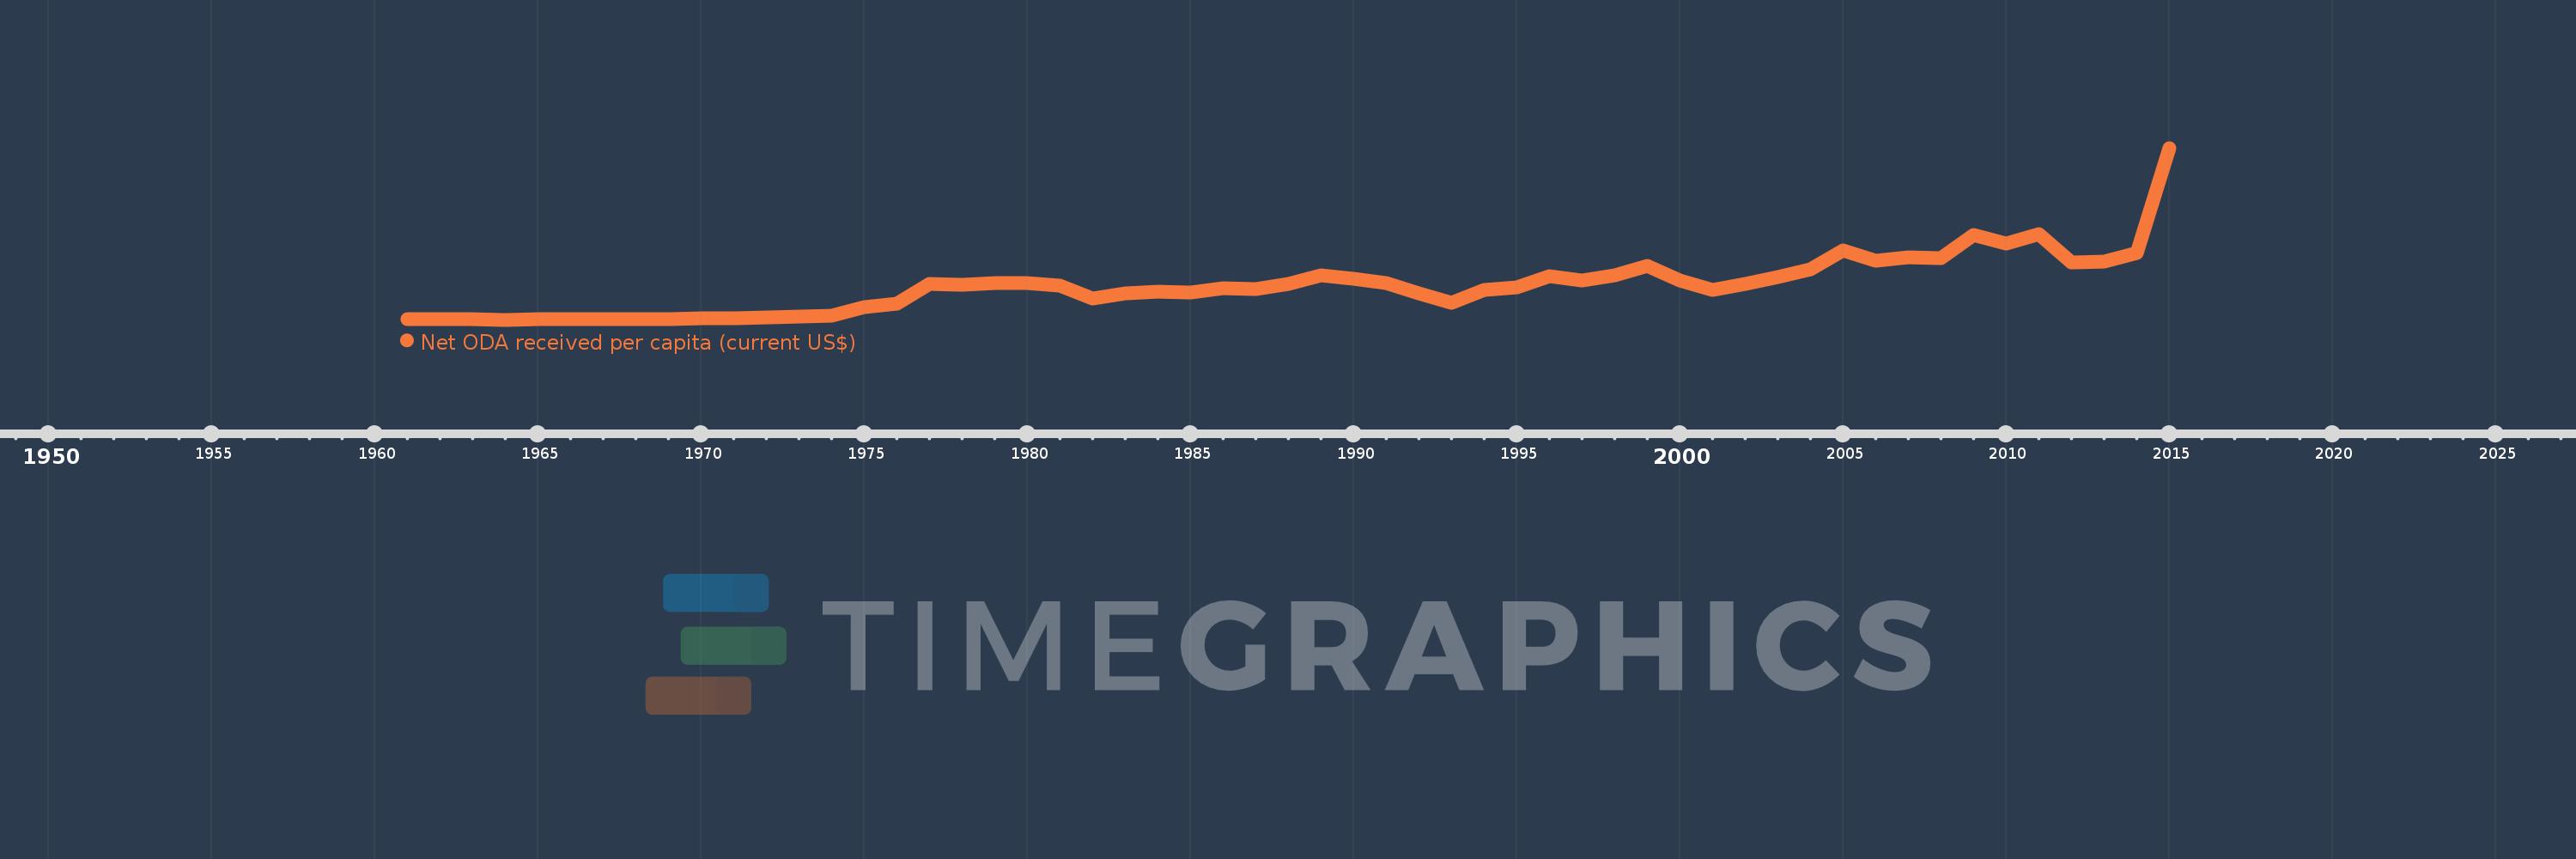
Net ODA received per capita (current US$)
2015,2014,2013,2012,2011,2010,2009,2008,2007,2006,2005,2004,2003,2002,2001,2000,1999,1998,1997,1996,1995,1994,1993,1992,1991,1990,1989,1988,1987,1986,1985,1984,1983,1982,1981,1980,1979,1978,1977,1976,1975,1974,1973,1972,1971,1970,1969,1968,1967,1966,1965,1964,1963,1962,1961
Estas estadísticas en otros países:
AfghanistanAlbaniaAlgeriaAngolaAntigua and BarbudaArab WorldArgentinaArmeniaArubaAzerbaijanBahamas, TheBahrainBangladeshBarbadosBelarusBelizeBeninBermudaBhutanBoliviaBosnia and HerzegovinaBotswanaBrazilBritish Virgin IslandsBrunei DarussalamBurkina FasoBurundiCabo VerdeCambodiaCameroonCaribbean small statesCayman IslandsCentral African RepublicCentral Europe and the BalticsChadChileChinaColombiaComorosCongo, Dem. Rep.Congo, Rep.Costa RicaCote d'IvoireCroatiaCubaCyprusDjiboutiDominicaDominican RepublicEast Asia & PacificEast Asia & Pacific (excluding high income)East Asia & Pacific (IDA & IBRD countries)EcuadorEgypt, Arab Rep.El SalvadorEquatorial GuineaEritreaEthiopiaEuro areaEurope & Central AsiaEurope & Central Asia (excluding high income)Europe & Central Asia (IDA & IBRD countries)European UnionFijiFragile and conflict affected situationsFrench PolynesiaGabonGambia, TheGeorgiaGhanaGibraltarGrenadaGuatemalaGuineaGuinea-BissauGuyanaHaitiHeavily indebted poor countries (HIPC)High incomeHondurasHong Kong SAR, ChinaIBRD onlyIDA & IBRD totalIDA blendIDA onlyIDA totalIndiaIndonesiaIran, Islamic Rep.IraqIsraelJamaicaJordanKazakhstanKenyaKiribatiKorea, Dem. People’s Rep.Korea, Rep.KosovoKuwaitKyrgyz RepublicLao PDRLatin America & Caribbean Latin America & Caribbean (excluding high income)Latin America & the Caribbean (IDA & IBRD countries)Least developed countries: UN classificationLebanonLesothoLiberiaLibyaLow & middle incomeLow incomeLower middle incomeMacao SAR, ChinaMacedonia, FYRMadagascarMalawiMalaysiaMaldivesMaliMaltaMarshall IslandsMauritaniaMauritiusMexicoMicronesia, Fed. Sts.Middle East & North AfricaMiddle East & North Africa (excluding high income)Middle East & North Africa (IDA & IBRD countries)Middle incomeMoldovaMongoliaMontenegroMoroccoMozambiqueMyanmarNamibiaNauruNepalNew CaledoniaNicaraguaNigerNigeriaNorth AmericaNorthern Mariana IslandsOECD membersOmanOther small statesPacific island small statesPakistanPalauPanamaPapua New GuineaParaguayPeruPhilippinesQatarRwandaSamoaSao Tome and PrincipeSaudi ArabiaSenegalSerbiaSeychellesSierra LeoneSingaporeSloveniaSmall statesSolomon IslandsSomaliaSouth AfricaSouth AsiaSouth Asia (IDA & IBRD)South SudanSri LankaSt. Kitts and NevisSt. LuciaSt. Vincent and the GrenadinesSub-Saharan Africa Sub-Saharan Africa (excluding high income)Sub-Saharan Africa (IDA & IBRD countries)SudanSurinameSwazilandSyrian Arab RepublicTajikistanTanzaniaThailandTimor-LesteTogoTongaTrinidad and TobagoTunisiaTurkeyTurkmenistanTurks and Caicos IslandsTuvaluUgandaUkraineUnited Arab EmiratesUpper middle incomeUruguayUzbekistanVanuatuVenezuela, RBVietnamWest Bank and GazaWorldYemen, Rep.ZambiaZimbabwe línea de tiempo (timeline):
En esta escala de tiempo se presenta un gráfico de 1961 y 2015 de Cuba. Los datos de 1960 están ausentes. El número de observaciones reales por fecha: 55.
Fuente (nombre):
Indicadores del desarrollo mundial
Fuente (organización):
Development Assistance Committee of the Organisation for Economic Co-operation and Development, Geographical Distribution of Financial Flows to Developing Countries, Development Co-operation Report, and International Development Statistics database. Data are available online at: www.oecd.org/dac/stats/idsonline. World Bank population estimates are used for the denominator.
Categorías:
Aid Effectiveness, Economy & Growth, External Debt
Se ha actualizado:
23 abr 2017 año
Los indicadores de los cambios de valor en los últimos años
Mínimo:
-0.022
1 ene 1964 año
Máximo:
22.997
1 ene 2015 año
A la fecha de observación
Valor
Cambio absoluto
El cambio con respecto al valor anterior
1 ene 1961 año
0.032
+0.032
0.0%
1 ene 1962 año
0.026
-0.006
-19.08%
1 ene 1963 año
0.005
-0.021
-79.4%
1 ene 1964 año
-0.022
-0.028
-515.63%
1 ene 1965 año
0.057
+0.079
-353.21%
1 ene 1966 año
0.073
+0.016
29.09%
1 ene 1967 año
0.09
+0.017
23.4%
1 ene 1968 año
0.09
0.0
-0.51%
1 ene 1969 año
0.077
-0.012
-13.73%
1 ene 1970 año
0.153
+0.076
98.01%
1 ene 1971 año
0.209
+0.056
36.51%
1 ene 1972 año
0.28
+0.071
33.89%
1 ene 1973 año
0.396
+0.116
41.47%
1 ene 1974 año
0.566
+0.17
42.99%
1 ene 1975 año
1.635
+1.069
189.06%
1 ene 1976 año
2.08
+0.445
27.21%
1 ene 1977 año
4.784
+2.704
130.02%
1 ene 1978 año
4.663
-0.121
-2.52%
1 ene 1979 año
4.942
+0.278
5.97%
1 ene 1980 año
4.899
-0.043
-0.86%
1 ene 1981 año
4.604
-0.295
-6.03%
1 ene 1982 año
2.769
-1.835
-39.85%
1 ene 1983 año
3.536
+0.767
27.71%
1 ene 1984 año
3.696
+0.16
4.52%
1 ene 1985 año
3.571
-0.125
-3.39%
1 ene 1986 año
4.164
+0.594
16.62%
1 ene 1987 año
4.109
-0.055
-1.33%
1 ene 1988 año
4.76
+0.651
15.84%
1 ene 1989 año
5.902
+1.142
24.0%
1 ene 1990 año
5.421
-0.482
-8.16%
1 ene 1991 año
4.896
-0.524
-9.68%
1 ene 1992 año
3.463
-1.433
-29.27%
1 ene 1993 año
2.273
-1.19
-34.37%
1 ene 1994 año
4.029
+1.756
77.26%
1 ene 1995 año
4.305
+0.276
6.85%
1 ene 1996 año
5.798
+1.493
34.69%
1 ene 1997 año
5.186
-0.611
-10.54%
1 ene 1998 año
5.939
+0.752
14.51%
1 ene 1999 año
7.252
+1.314
22.12%
1 ene 2000 año
5.279
-1.974
-27.22%
1 ene 2001 año
3.957
-1.322
-25.04%
1 ene 2002 año
4.816
+0.858
21.69%
1 ene 2003 año
5.694
+0.878
18.23%
1 ene 2004 año
6.689
+0.996
17.49%
1 ene 2005 año
9.211
+2.522
37.7%
1 ene 2006 año
7.848
-1.363
-14.8%
1 ene 2007 año
8.311
+0.463
5.9%
1 ene 2008 año
8.224
-0.087
-1.05%
1 ene 2009 año
11.291
+3.067
37.3%
1 ene 2010 año
10.185
-1.106
-9.79%
1 ene 2011 año
11.419
+1.234
12.11%
1 ene 2012 año
7.689
-3.73
-32.66%
1 ene 2013 año
7.742
+0.052
0.68%
1 ene 2014 año
8.896
+1.154
14.91%
1 ene 2015 año
22.997
+14.101
158.52%
Ranking de los países por los datos estadísticos actuales


Comentarios: