29
/es/
es
AIzaSyAYiBZKx7MnpbEhh9jyipgxe19OcubqV5w
April 1, 2024
244840
Somalia
SOM
true
2
1
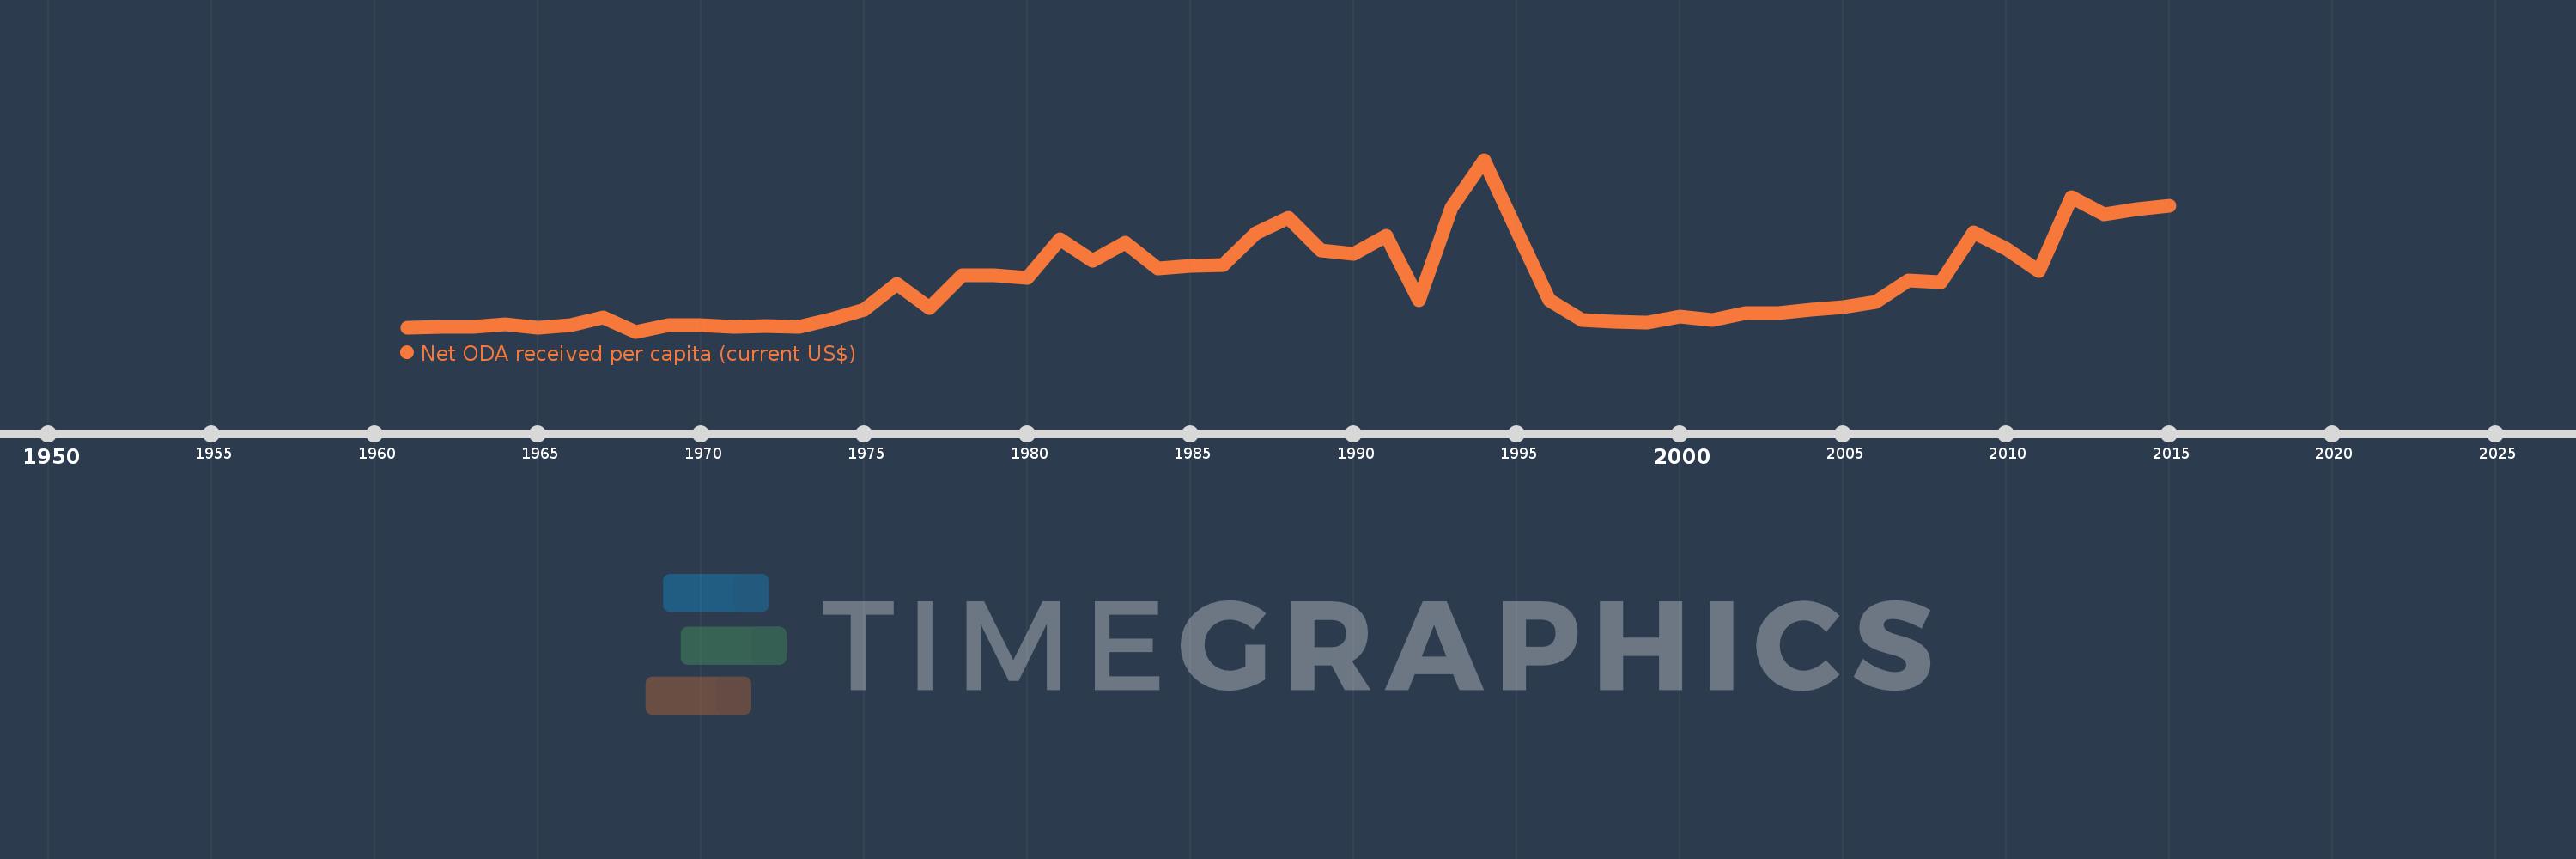
Net ODA received per capita (current US$)
2015,2014,2013,2012,2011,2010,2009,2008,2007,2006,2005,2004,2003,2002,2001,2000,1999,1998,1997,1996,1995,1994,1993,1992,1991,1990,1989,1988,1987,1986,1985,1984,1983,1982,1981,1980,1979,1978,1977,1976,1975,1974,1973,1972,1971,1970,1969,1968,1967,1966,1965,1964,1963,1962,1961
Estas estadísticas en otros países:
AfghanistanAlbaniaAlgeriaAngolaAntigua and BarbudaArab WorldArgentinaArmeniaArubaAzerbaijanBahamas, TheBahrainBangladeshBarbadosBelarusBelizeBeninBermudaBhutanBoliviaBosnia and HerzegovinaBotswanaBrazilBritish Virgin IslandsBrunei DarussalamBurkina FasoBurundiCabo VerdeCambodiaCameroonCaribbean small statesCayman IslandsCentral African RepublicCentral Europe and the BalticsChadChileChinaColombiaComorosCongo, Dem. Rep.Congo, Rep.Costa RicaCote d'IvoireCroatiaCubaCyprusDjiboutiDominicaDominican RepublicEast Asia & PacificEast Asia & Pacific (excluding high income)East Asia & Pacific (IDA & IBRD countries)EcuadorEgypt, Arab Rep.El SalvadorEquatorial GuineaEritreaEthiopiaEuro areaEurope & Central AsiaEurope & Central Asia (excluding high income)Europe & Central Asia (IDA & IBRD countries)European UnionFijiFragile and conflict affected situationsFrench PolynesiaGabonGambia, TheGeorgiaGhanaGibraltarGrenadaGuatemalaGuineaGuinea-BissauGuyanaHaitiHeavily indebted poor countries (HIPC)High incomeHondurasHong Kong SAR, ChinaIBRD onlyIDA & IBRD totalIDA blendIDA onlyIDA totalIndiaIndonesiaIran, Islamic Rep.IraqIsraelJamaicaJordanKazakhstanKenyaKiribatiKorea, Dem. People’s Rep.Korea, Rep.KosovoKuwaitKyrgyz RepublicLao PDRLatin America & Caribbean Latin America & Caribbean (excluding high income)Latin America & the Caribbean (IDA & IBRD countries)Least developed countries: UN classificationLebanonLesothoLiberiaLibyaLow & middle incomeLow incomeLower middle incomeMacao SAR, ChinaMacedonia, FYRMadagascarMalawiMalaysiaMaldivesMaliMaltaMarshall IslandsMauritaniaMauritiusMexicoMicronesia, Fed. Sts.Middle East & North AfricaMiddle East & North Africa (excluding high income)Middle East & North Africa (IDA & IBRD countries)Middle incomeMoldovaMongoliaMontenegroMoroccoMozambiqueMyanmarNamibiaNauruNepalNew CaledoniaNicaraguaNigerNigeriaNorth AmericaNorthern Mariana IslandsOECD membersOmanOther small statesPacific island small statesPakistanPalauPanamaPapua New GuineaParaguayPeruPhilippinesQatarRwandaSamoaSao Tome and PrincipeSaudi ArabiaSenegalSerbiaSeychellesSierra LeoneSingaporeSloveniaSmall statesSolomon IslandsSomaliaSouth AfricaSouth AsiaSouth Asia (IDA & IBRD)South SudanSri LankaSt. Kitts and NevisSt. LuciaSt. Vincent and the GrenadinesSub-Saharan Africa Sub-Saharan Africa (excluding high income)Sub-Saharan Africa (IDA & IBRD countries)SudanSurinameSwazilandSyrian Arab RepublicTajikistanTanzaniaThailandTimor-LesteTogoTongaTrinidad and TobagoTunisiaTurkeyTurkmenistanTurks and Caicos IslandsTuvaluUgandaUkraineUnited Arab EmiratesUpper middle incomeUruguayUzbekistanVanuatuVenezuela, RBVietnamWest Bank and GazaWorldYemen, Rep.ZambiaZimbabwe línea de tiempo (timeline):
En esta escala de tiempo se presenta un gráfico de 1961 y 2015 de Somalia. Los datos de 1960 están ausentes. El número de observaciones reales por fecha: 55.
Fuente (nombre):
Indicadores del desarrollo mundial
Fuente (organización):
Development Assistance Committee of the Organisation for Economic Co-operation and Development, Geographical Distribution of Financial Flows to Developing Countries, Development Co-operation Report, and International Development Statistics database. Data are available online at: www.oecd.org/dac/stats/idsonline. World Bank population estimates are used for the denominator.
Categorías:
Aid Effectiveness, Economy & Growth, External Debt
Se ha actualizado:
23 abr 2017 año
Los indicadores de los cambios de valor en los últimos años
Mínimo:
4.465
1 ene 1968 año
Máximo:
142.301
1 ene 1994 año
A la fecha de observación
Valor
Cambio absoluto
El cambio con respecto al valor anterior
1 ene 1961 año
7.789
+7.789
0.0%
1 ene 1962 año
8.246
+0.457
5.87%
1 ene 1963 año
8.268
+0.022
0.27%
1 ene 1964 año
10.366
+2.098
25.38%
1 ene 1965 año
7.245
-3.122
-30.11%
1 ene 1966 año
9.34
+2.095
28.92%
1 ene 1967 año
15.975
+6.635
71.04%
1 ene 1968 año
4.465
-11.51
-72.05%
1 ene 1969 año
9.634
+5.169
115.77%
1 ene 1970 año
9.736
+0.102
1.06%
1 ene 1971 año
8.016
-1.719
-17.66%
1 ene 1972 año
8.791
+0.774
9.66%
1 ene 1973 año
8.518
-0.273
-3.1%
1 ene 1974 año
14.45
+5.933
69.65%
1 ene 1975 año
22.211
+7.761
53.71%
1 ene 1976 año
42.618
+20.407
91.88%
1 ene 1977 año
23.746
-18.872
-44.28%
1 ene 1978 año
49.42
+25.674
108.12%
1 ene 1979 año
49.733
+0.313
0.63%
1 ene 1980 año
47.594
-2.139
-4.3%
1 ene 1981 año
78.815
+31.221
65.6%
1 ene 1982 año
61.164
-17.651
-22.4%
1 ene 1983 año
75.56
+14.397
23.54%
1 ene 1984 año
55.008
-20.553
-27.2%
1 ene 1985 año
56.858
+1.851
3.36%
1 ene 1986 año
57.793
+0.934
1.64%
1 ene 1987 año
83.269
+25.476
44.08%
1 ene 1988 año
95.631
+12.362
14.85%
1 ene 1989 año
69.438
-26.193
-27.39%
1 ene 1990 año
66.686
-2.752
-3.96%
1 ene 1991 año
81.436
+14.751
22.12%
1 ene 1992 año
29.499
-51.937
-63.78%
1 ene 1993 año
103.854
+74.355
252.06%
1 ene 1994 año
142.301
+38.447
37.02%
1 ene 1995 año
85.225
-57.076
-40.11%
1 ene 1996 año
29.612
-55.613
-65.25%
1 ene 1997 año
13.606
-16.006
-54.05%
1 ene 1998 año
12.166
-1.44
-10.59%
1 ene 1999 año
11.778
-0.388
-3.19%
1 ene 2000 año
16.185
+4.407
37.42%
1 ene 2001 año
13.842
-2.343
-14.48%
1 ene 2002 año
19.619
+5.777
41.73%
1 ene 2003 año
19.511
-0.107
-0.55%
1 ene 2004 año
21.915
+2.404
12.32%
1 ene 2005 año
24.394
+2.479
11.31%
1 ene 2006 año
28.372
+3.977
16.3%
1 ene 2007 año
45.605
+17.234
60.74%
1 ene 2008 año
44.196
-1.41
-3.09%
1 ene 2009 año
83.861
+39.666
89.75%
1 ene 2010 año
70.712
-13.149
-15.68%
1 ene 2011 año
52.776
-17.936
-25.37%
1 ene 2012 año
112.065
+59.289
112.34%
1 ene 2013 año
98.681
-13.383
-11.94%
1 ene 2014 año
102.672
+3.991
4.04%
1 ene 2015 año
105.479
+2.807
2.73%
Ranking de los países por los datos estadísticos actuales


Comentarios: