29
/es/
es
AIzaSyAYiBZKx7MnpbEhh9jyipgxe19OcubqV5w
April 1, 2024
31923
Europe & Central Asia (excluding high income)
ECA
false
2
1
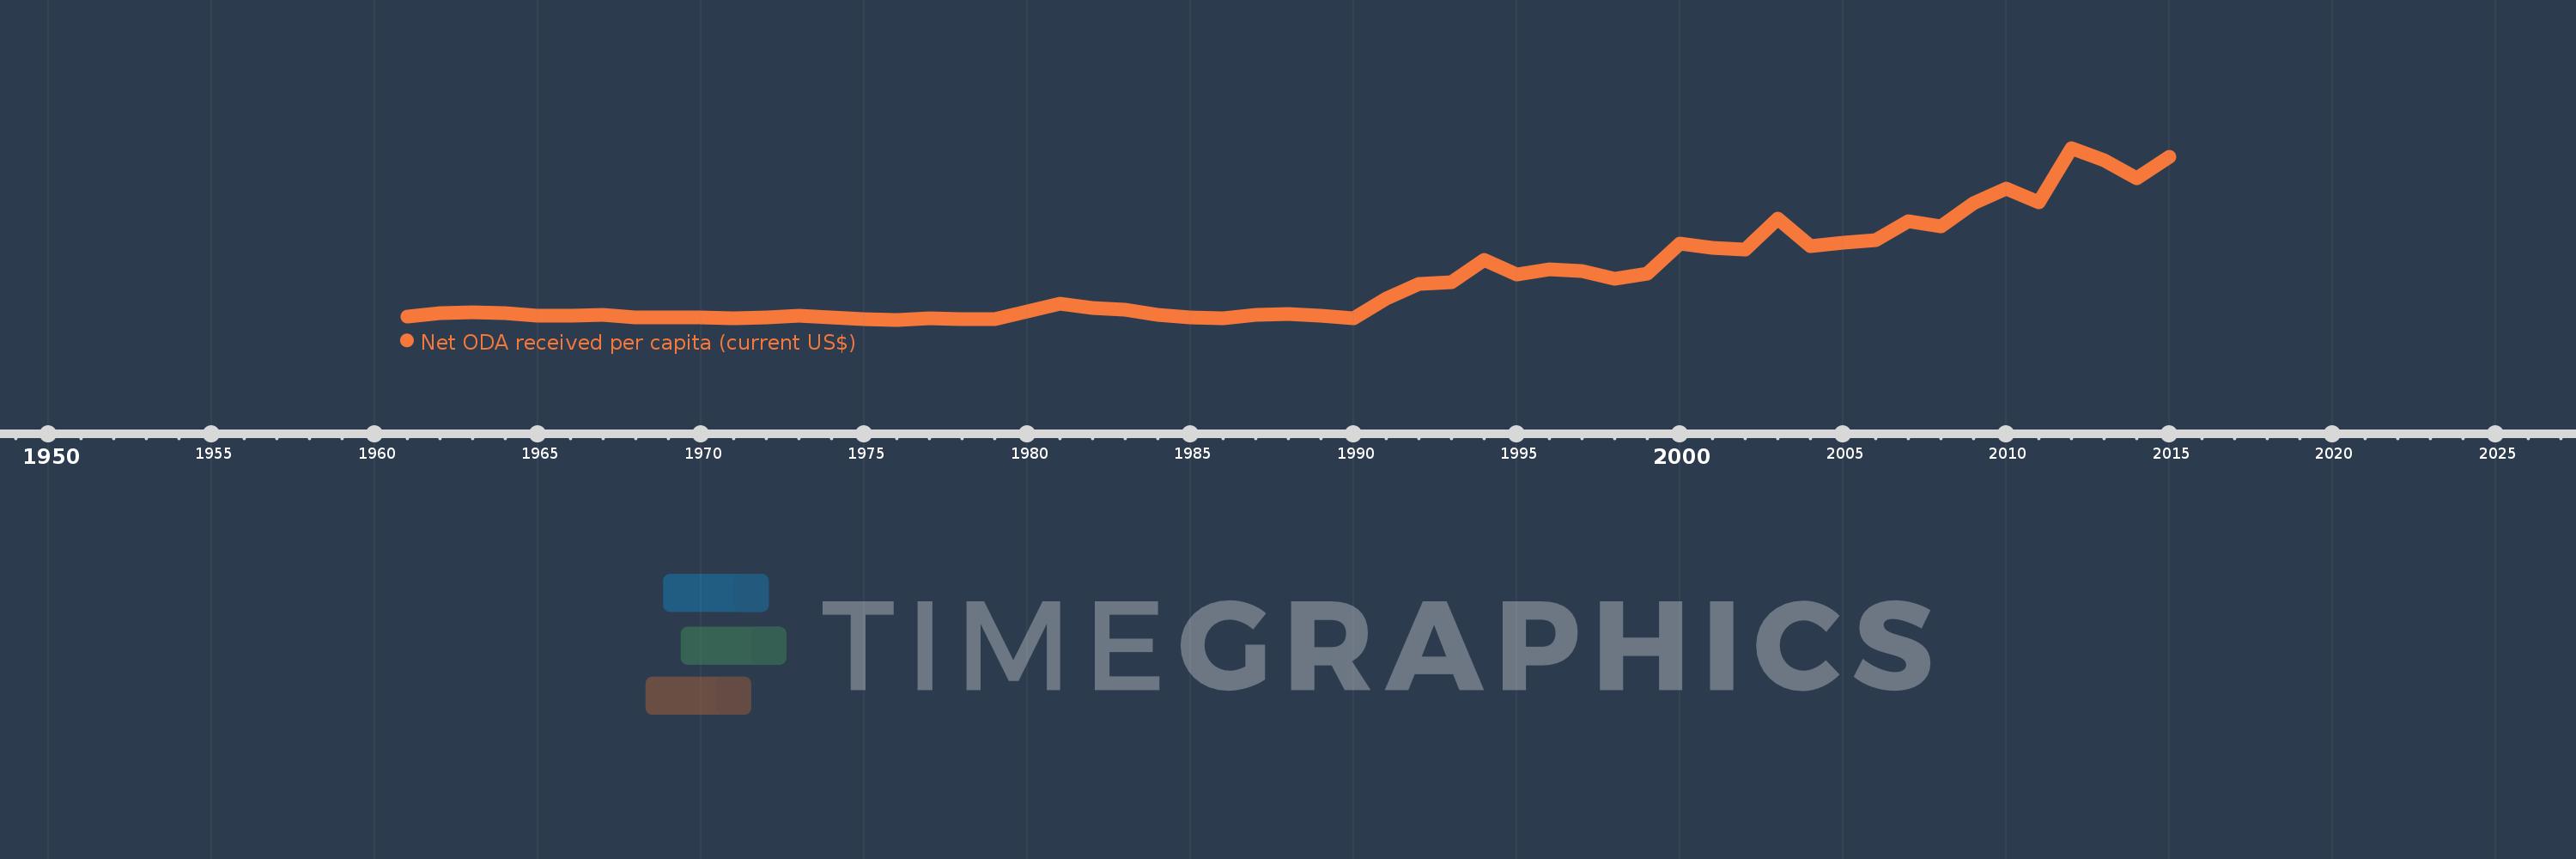
Net ODA received per capita (current US$)
2015,2014,2013,2012,2011,2010,2009,2008,2007,2006,2005,2004,2003,2002,2001,2000,1999,1998,1997,1996,1995,1994,1993,1992,1991,1990,1989,1988,1987,1986,1985,1984,1983,1982,1981,1980,1979,1978,1977,1976,1975,1974,1973,1972,1971,1970,1969,1968,1967,1966,1965,1964,1963,1962,1961
Estas estadísticas en otros países:
AfghanistanAlbaniaAlgeriaAngolaAntigua and BarbudaArab WorldArgentinaArmeniaArubaAzerbaijanBahamas, TheBahrainBangladeshBarbadosBelarusBelizeBeninBermudaBhutanBoliviaBosnia and HerzegovinaBotswanaBrazilBritish Virgin IslandsBrunei DarussalamBurkina FasoBurundiCabo VerdeCambodiaCameroonCaribbean small statesCayman IslandsCentral African RepublicCentral Europe and the BalticsChadChileChinaColombiaComorosCongo, Dem. Rep.Congo, Rep.Costa RicaCote d'IvoireCroatiaCubaCyprusDjiboutiDominicaDominican RepublicEast Asia & PacificEast Asia & Pacific (excluding high income)East Asia & Pacific (IDA & IBRD countries)EcuadorEgypt, Arab Rep.El SalvadorEquatorial GuineaEritreaEthiopiaEuro areaEurope & Central AsiaEurope & Central Asia (excluding high income)Europe & Central Asia (IDA & IBRD countries)European UnionFijiFragile and conflict affected situationsFrench PolynesiaGabonGambia, TheGeorgiaGhanaGibraltarGrenadaGuatemalaGuineaGuinea-BissauGuyanaHaitiHeavily indebted poor countries (HIPC)High incomeHondurasHong Kong SAR, ChinaIBRD onlyIDA & IBRD totalIDA blendIDA onlyIDA totalIndiaIndonesiaIran, Islamic Rep.IraqIsraelJamaicaJordanKazakhstanKenyaKiribatiKorea, Dem. People’s Rep.Korea, Rep.KosovoKuwaitKyrgyz RepublicLao PDRLatin America & Caribbean Latin America & Caribbean (excluding high income)Latin America & the Caribbean (IDA & IBRD countries)Least developed countries: UN classificationLebanonLesothoLiberiaLibyaLow & middle incomeLow incomeLower middle incomeMacao SAR, ChinaMacedonia, FYRMadagascarMalawiMalaysiaMaldivesMaliMaltaMarshall IslandsMauritaniaMauritiusMexicoMicronesia, Fed. Sts.Middle East & North AfricaMiddle East & North Africa (excluding high income)Middle East & North Africa (IDA & IBRD countries)Middle incomeMoldovaMongoliaMontenegroMoroccoMozambiqueMyanmarNamibiaNauruNepalNew CaledoniaNicaraguaNigerNigeriaNorth AmericaNorthern Mariana IslandsOECD membersOmanOther small statesPacific island small statesPakistanPalauPanamaPapua New GuineaParaguayPeruPhilippinesQatarRwandaSamoaSao Tome and PrincipeSaudi ArabiaSenegalSerbiaSeychellesSierra LeoneSingaporeSloveniaSmall statesSolomon IslandsSomaliaSouth AfricaSouth AsiaSouth Asia (IDA & IBRD)South SudanSri LankaSt. Kitts and NevisSt. LuciaSt. Vincent and the GrenadinesSub-Saharan Africa Sub-Saharan Africa (excluding high income)Sub-Saharan Africa (IDA & IBRD countries)SudanSurinameSwazilandSyrian Arab RepublicTajikistanTanzaniaThailandTimor-LesteTogoTongaTrinidad and TobagoTunisiaTurkeyTurkmenistanTurks and Caicos IslandsTuvaluUgandaUkraineUnited Arab EmiratesUpper middle incomeUruguayUzbekistanVanuatuVenezuela, RBVietnamWest Bank and GazaWorldYemen, Rep.ZambiaZimbabwe línea de tiempo (timeline):
En esta escala de tiempo se presenta un gráfico de 1961 y 2015 de Europe & Central Asia (excluding high income). Los datos de 1960 están ausentes. El número de observaciones reales por fecha: 55.
Fuente (nombre):
Indicadores del desarrollo mundial
Fuente (organización):
Development Assistance Committee of the Organisation for Economic Co-operation and Development, Geographical Distribution of Financial Flows to Developing Countries, Development Co-operation Report, and International Development Statistics database. Data are available online at: www.oecd.org/dac/stats/idsonline. World Bank population estimates are used for the denominator.
Categorías:
Aid Effectiveness, Economy & Growth, External Debt
Se ha actualizado:
23 abr 2017 año
Los indicadores de los cambios de valor en los últimos años
Mínimo:
0.253
1 ene 1976 año
Máximo:
26.698
1 ene 2012 año
A la fecha de observación
Valor
Cambio absoluto
El cambio con respecto al valor anterior
1 ene 1961 año
0.753
+0.753
0.0%
1 ene 1962 año
1.264
+0.511
67.94%
1 ene 1963 año
1.393
+0.129
10.2%
1 ene 1964 año
1.311
-0.083
-5.92%
1 ene 1965 año
0.9
-0.411
-31.32%
1 ene 1966 año
0.897
-0.003
-0.35%
1 ene 1967 año
1.061
+0.164
18.28%
1 ene 1968 año
0.662
-0.399
-37.64%
1 ene 1969 año
0.546
-0.116
-17.47%
1 ene 1970 año
0.574
+0.028
5.12%
1 ene 1971 año
0.435
-0.139
-24.16%
1 ene 1972 año
0.629
+0.194
44.56%
1 ene 1973 año
0.834
+0.204
32.46%
1 ene 1974 año
0.63
-0.204
-24.43%
1 ene 1975 año
0.347
-0.283
-44.85%
1 ene 1976 año
0.253
-0.094
-27.09%
1 ene 1977 año
0.468
+0.215
84.96%
1 ene 1978 año
0.295
-0.174
-37.12%
1 ene 1979 año
0.381
+0.086
29.31%
1 ene 1980 año
1.601
+1.22
320.29%
1 ene 1981 año
2.675
+1.075
67.14%
1 ene 1982 año
2.015
-0.661
-24.7%
1 ene 1983 año
1.791
-0.223
-11.08%
1 ene 1984 año
0.994
-0.798
-44.53%
1 ene 1985 año
0.667
-0.326
-32.83%
1 ene 1986 año
0.517
-0.15
-22.55%
1 ene 1987 año
0.963
+0.446
86.26%
1 ene 1988 año
1.101
+0.138
14.32%
1 ene 1989 año
0.872
-0.228
-20.74%
1 ene 1990 año
0.517
-0.355
-40.69%
1 ene 1991 año
3.53
+3.012
582.29%
1 ene 1992 año
5.715
+2.185
61.91%
1 ene 1993 año
6.04
+0.325
5.68%
1 ene 1994 año
9.492
+3.452
57.15%
1 ene 1995 año
7.172
-2.32
-24.44%
1 ene 1996 año
8.032
+0.86
11.99%
1 ene 1997 año
7.762
-0.27
-3.36%
1 ene 1998 año
6.59
-1.172
-15.1%
1 ene 1999 año
7.396
+0.806
12.22%
1 ene 2000 año
11.968
+4.573
61.83%
1 ene 2001 año
11.382
-0.587
-4.9%
1 ene 2002 año
11.031
-0.351
-3.08%
1 ene 2003 año
15.857
+4.826
43.75%
1 ene 2004 año
11.583
-4.273
-26.95%
1 ene 2005 año
12.11
+0.527
4.55%
1 ene 2006 año
12.464
+0.354
2.92%
1 ene 2007 año
15.439
+2.975
23.87%
1 ene 2008 año
14.661
-0.778
-5.04%
1 ene 2009 año
18.233
+3.572
24.36%
1 ene 2010 año
20.396
+2.163
11.86%
1 ene 2011 año
18.315
-2.081
-10.2%
1 ene 2012 año
26.698
+8.383
45.77%
1 ene 2013 año
24.742
-1.956
-7.33%
1 ene 2014 año
22.073
-2.669
-10.79%
1 ene 2015 año
25.349
+3.275
14.84%
Ranking de los países por los datos estadísticos actuales


Comentarios: