29
/es/
es
AIzaSyAYiBZKx7MnpbEhh9jyipgxe19OcubqV5w
April 1, 2024
79144
Barbados
BRB
true
2
1
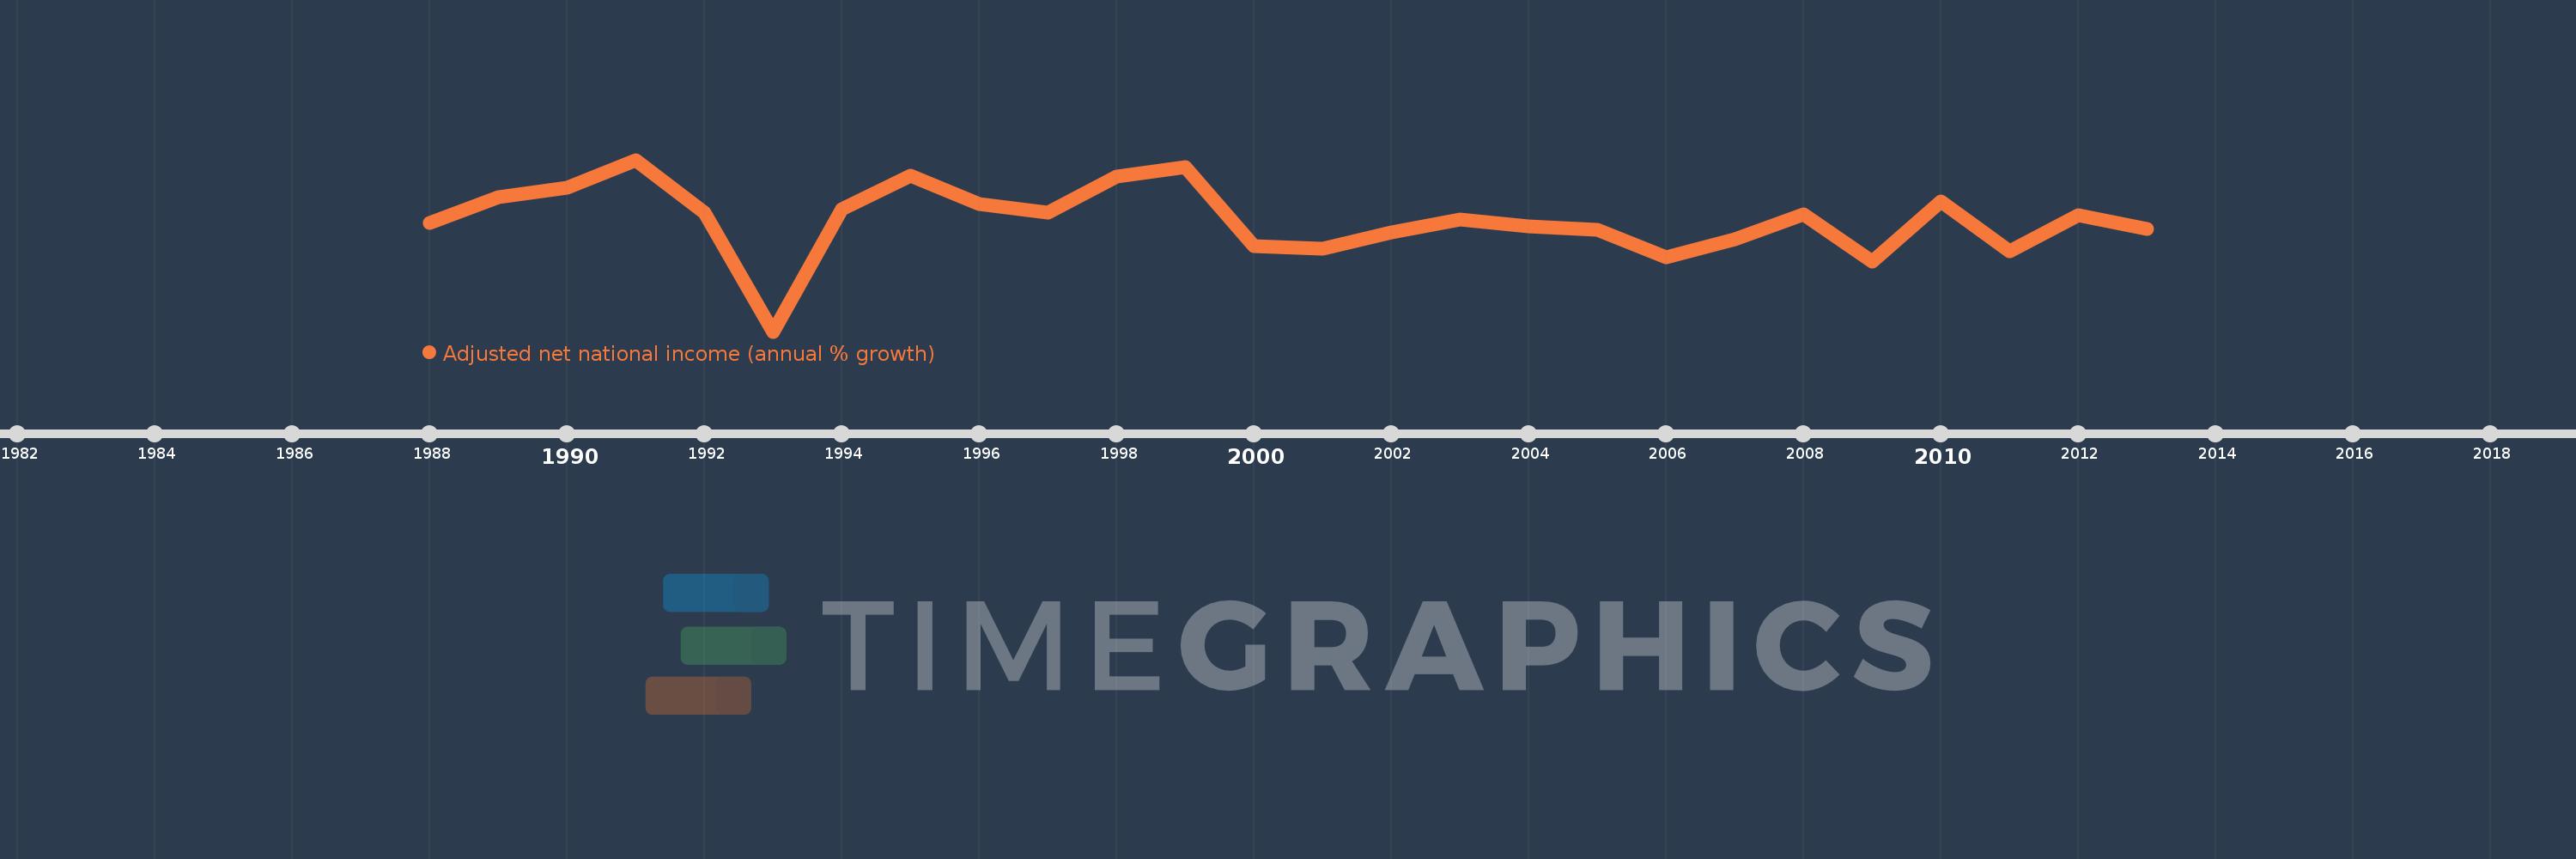
Adjusted net national income (annual % growth)
2013,2012,2011,2010,2009,2008,2007,2006,2005,2004,2003,2002,2001,2000,1999,1998,1997,1996,1995,1994,1993,1992,1991,1990,1989,1988
Estas estadísticas en otros países:
línea de tiempo (timeline):
En esta escala de tiempo se presenta un gráfico de 1988 y 2013 de Barbados. Los datos de 1987 están ausentes. El número de observaciones reales por fecha: 26.
Fuente (nombre):
Indicadores del desarrollo mundial
Fuente (organización):
World Bank staff estimates based on sources and methods in World Bank's "The Changing Wealth of Nations: Measuring Sustainable Development in the New Millennium" (2011).
Categorías:
Economy & Growth
Se ha actualizado:
23 abr 2017 año
Los indicadores de los cambios de valor en los últimos años
Mínimo:
-16.14
1 ene 1993 año
Máximo:
10.109
1 ene 1991 año
A la fecha de observación
Valor
Cambio absoluto
El cambio con respecto al valor anterior
1 ene 1988 año
0.452
+0.452
0.0%
1 ene 1989 año
4.413
+3.962
877.2%
1 ene 1990 año
5.854
+1.44
32.64%
1 ene 1991 año
10.109
+4.255
72.69%
1 ene 1992 año
2.013
-8.096
-80.09%
1 ene 1993 año
-16.14
-18.153
-901.73%
1 ene 1994 año
2.533
+18.673
-115.69%
1 ene 1995 año
7.714
+5.181
204.53%
1 ene 1996 año
3.384
-4.329
-56.12%
1 ene 1997 año
2.05
-1.335
-39.44%
1 ene 1998 año
7.53
+5.481
267.4%
1 ene 1999 año
8.969
+1.439
19.11%
1 ene 2000 año
-3.102
-12.071
-134.59%
1 ene 2001 año
-3.472
-0.369
11.91%
1 ene 2002 año
-0.945
+2.527
-72.78%
1 ene 2003 año
1.01
+1.955
-206.88%
1 ene 2004 año
-0.106
-1.116
-110.49%
1 ene 2005 año
-0.653
-0.547
515.88%
1 ene 2006 año
-4.779
-4.127
632.44%
1 ene 2007 año
-2.001
+2.778
-58.13%
1 ene 2008 año
1.742
+3.743
-187.05%
1 ene 2009 año
-5.469
-7.211
-413.95%
1 ene 2010 año
3.809
+9.277
-169.64%
1 ene 2011 año
-3.896
-7.705
-202.3%
1 ene 2012 año
1.673
+5.569
-142.94%
1 ene 2013 año
-0.472
-2.145
-128.21%
Ranking de los países por los datos estadísticos actuales


Comentarios: