29
/es/
es
AIzaSyAYiBZKx7MnpbEhh9jyipgxe19OcubqV5w
April 1, 2024
266491
Trinidad and Tobago
TTO
true
2
1
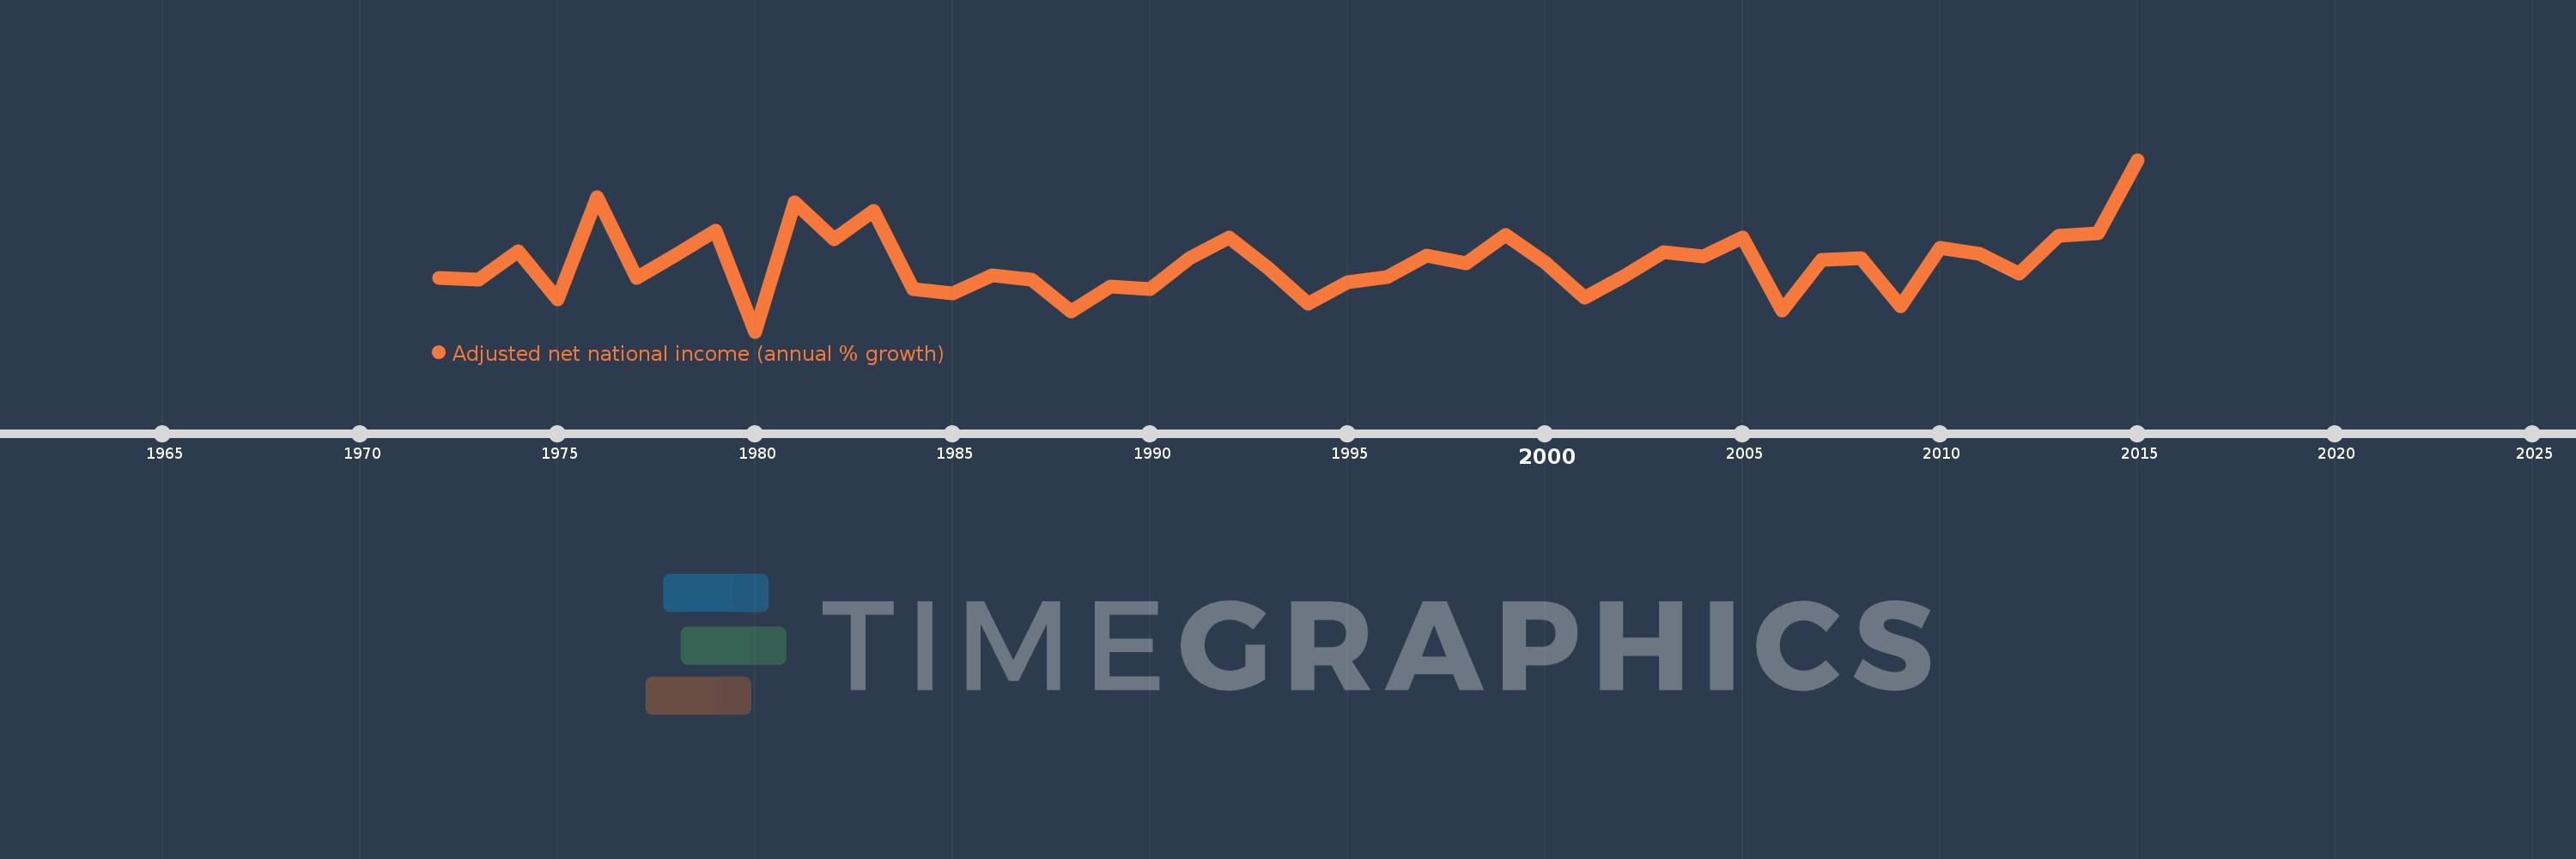
Adjusted net national income (annual % growth)
2015,2014,2013,2012,2011,2010,2009,2008,2007,2006,2005,2004,2003,2002,2001,2000,1999,1998,1997,1996,1995,1994,1993,1992,1991,1990,1989,1988,1987,1986,1985,1984,1983,1982,1981,1980,1979,1978,1977,1976,1975,1974,1973,1972
Estas estadísticas en otros países:
línea de tiempo (timeline):
En esta escala de tiempo se presenta un gráfico de 1972 y 2015 de Trinidad and Tobago. Los datos de 1971 están ausentes. El número de observaciones reales por fecha: 44.
Fuente (nombre):
Indicadores del desarrollo mundial
Fuente (organización):
World Bank staff estimates based on sources and methods in World Bank's "The Changing Wealth of Nations: Measuring Sustainable Development in the New Millennium" (2011).
Categorías:
Economy & Growth
Se ha actualizado:
23 abr 2017 año
Los indicadores de los cambios de valor en los últimos años
Mínimo:
-23.462
1 ene 1980 año
Máximo:
46.0
1 ene 2015 año
A la fecha de observación
Valor
Cambio absoluto
El cambio con respecto al valor anterior
1 ene 1972 año
-1.607
-1.607
0.0%
1 ene 1973 año
-2.374
-0.766
47.68%
1 ene 1974 año
9.134
+11.508
-484.84%
1 ene 1975 año
-10.343
-19.478
-213.23%
1 ene 1976 año
31.036
+41.379
-400.06%
1 ene 1977 año
-1.884
-32.92
-106.07%
1 ene 1978 año
7.612
+9.497
-503.93%
1 ene 1979 año
17.245
+9.633
126.55%
1 ene 1980 año
-23.462
-40.707
-236.05%
1 ene 1981 año
28.779
+52.242
-222.66%
1 ene 1982 año
13.718
-15.062
-52.34%
1 ene 1983 año
25.286
+11.568
84.33%
1 ene 1984 año
-6.165
-31.451
-124.38%
1 ene 1985 año
-7.948
-1.783
28.92%
1 ene 1986 año
-0.546
+7.402
-93.13%
1 ene 1987 año
-2.496
-1.95
357.09%
1 ene 1988 año
-15.216
-12.72
509.56%
1 ene 1989 año
-5.252
+9.965
-65.49%
1 ene 1990 año
-6.437
-1.186
22.58%
1 ene 1991 año
6.191
+12.628
-196.17%
1 ene 1992 año
14.736
+8.545
138.02%
1 ene 1993 año
1.896
-12.84
-87.13%
1 ene 1994 año
-12.31
-14.206
-749.21%
1 ene 1995 año
-3.478
+8.832
-71.75%
1 ene 1996 año
-1.499
+1.979
-56.91%
1 ene 1997 año
7.213
+8.712
-581.26%
1 ene 1998 año
4.094
-3.119
-43.24%
1 ene 1999 año
15.765
+11.671
285.06%
1 ene 2000 año
4.404
-11.361
-72.07%
1 ene 2001 año
-9.573
-13.977
-317.4%
1 ene 2002 año
-1.215
+8.358
-87.31%
1 ene 2003 año
8.725
+9.94
-818.15%
1 ene 2004 año
6.939
-1.787
-20.48%
1 ene 2005 año
14.63
+7.692
110.85%
1 ene 2006 año
-14.804
-29.434
-201.19%
1 ene 2007 año
5.481
+20.285
-137.03%
1 ene 2008 año
6.22
+0.738
13.47%
1 ene 2009 año
-13.335
-19.555
-314.41%
1 ene 2010 año
10.401
+23.736
-178.0%
1 ene 2011 año
7.944
-2.457
-23.62%
1 ene 2012 año
-0.033
-7.976
-100.41%
1 ene 2013 año
15.103
+15.135
-46.4 mil%
1 ene 2014 año
16.375
+1.273
8.43%
1 ene 2015 año
46.0
+29.625
180.91%
Ranking de los países por los datos estadísticos actuales


Comentarios: