29
/es/
es
AIzaSyAYiBZKx7MnpbEhh9jyipgxe19OcubqV5w
April 1, 2024
56723
South Asia
SAS
false
2
1
Adjusted net national income (annual % growth)
2015,2014,2013,2012,2011,2010,2009,2008,2007,2006,2005,2004,2003,2002,2001,2000,1999,1998,1997,1996,1995,1994,1993,1992,1991,1990,1989,1988,1987,1986,1985,1984,1983,1982,1981,1980,1979,1978,1977,1976,1975,1974,1973,1972
Estas estadísticas en otros países:
línea de tiempo (timeline):
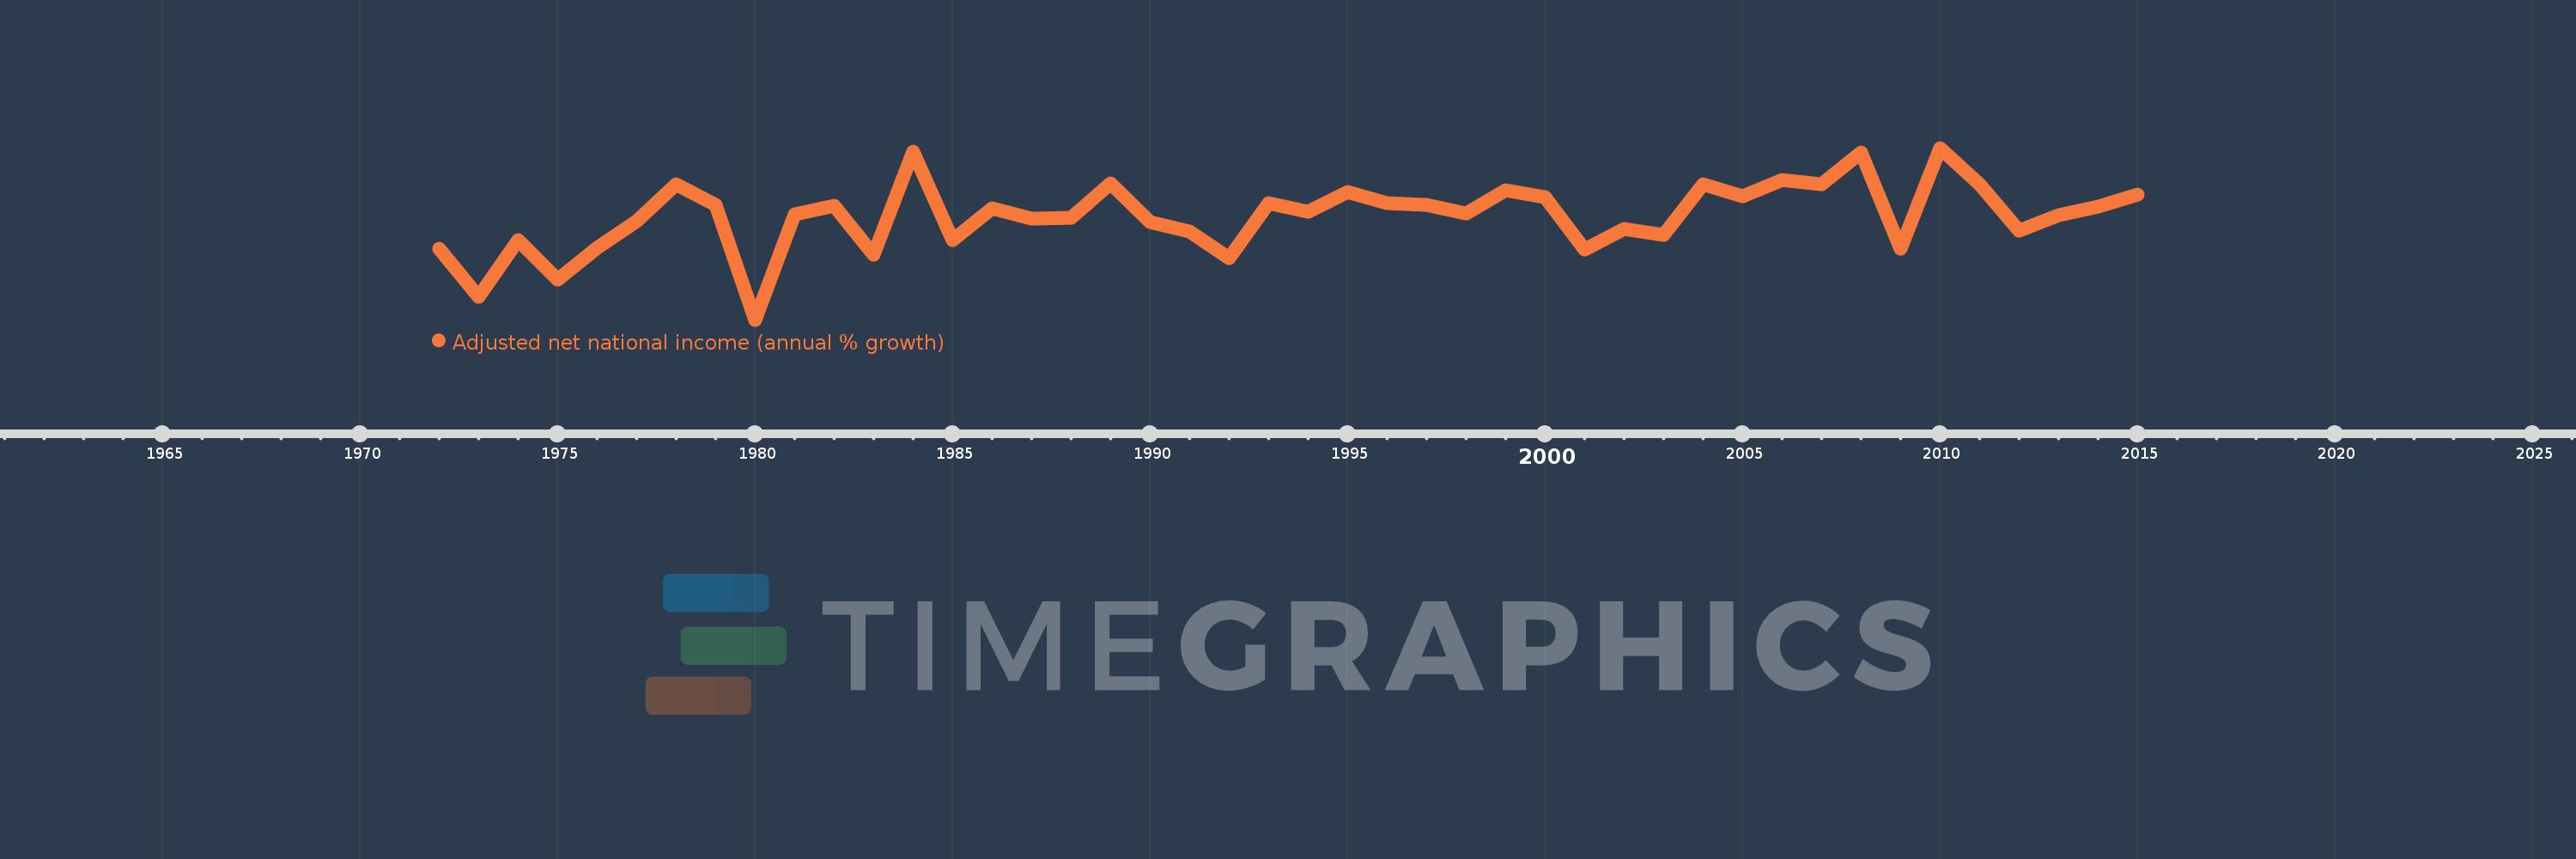
En esta escala de tiempo se presenta un gráfico de 1972 y 2015 de South Asia. Los datos de 1971 están ausentes. El número de observaciones reales por fecha: 44.
Fuente (nombre):
Indicadores del desarrollo mundial
Fuente (organización):
World Bank staff estimates based on sources and methods in World Bank's "The Changing Wealth of Nations: Measuring Sustainable Development in the New Millennium" (2011).
Categorías:
Economy & Growth
Se ha actualizado:
23 abr 2017 año
Los indicadores de los cambios de valor en los últimos años
Mínimo:
-3.83
1 ene 1980 año
Máximo:
10.982
1 ene 2010 año
A la fecha de observación
Valor
Cambio absoluto
El cambio con respecto al valor anterior
1 ene 1972 año
2.304
+2.304
0.0%
1 ene 1973 año
-1.875
-4.179
-181.37%
1 ene 1974 año
3.002
+4.877
-260.11%
1 ene 1975 año
-0.404
-3.406
-113.45%
1 ene 1976 año
2.366
+2.769
-685.98%
1 ene 1977 año
4.642
+2.277
96.24%
1 ene 1978 año
7.856
+3.214
69.23%
1 ene 1979 año
6.055
-1.801
-22.92%
1 ene 1980 año
-3.83
-9.885
-163.24%
1 ene 1981 año
5.292
+9.121
-238.18%
1 ene 1982 año
6.011
+0.719
13.6%
1 ene 1983 año
1.782
-4.229
-70.36%
1 ene 1984 año
10.671
+8.889
498.85%
1 ene 1985 año
3.039
-7.632
-71.52%
1 ene 1986 año
5.756
+2.718
89.43%
1 ene 1987 año
4.906
-0.85
-14.77%
1 ene 1988 año
4.976
+0.069
1.41%
1 ene 1989 año
7.907
+2.932
58.92%
1 ene 1990 año
4.627
-3.28
-41.48%
1 ene 1991 año
3.747
-0.881
-19.03%
1 ene 1992 año
1.451
-2.295
-61.27%
1 ene 1993 año
6.211
+4.759
327.96%
1 ene 1994 año
5.511
-0.699
-11.26%
1 ene 1995 año
7.173
+1.662
30.16%
1 ene 1996 año
6.207
-0.967
-13.47%
1 ene 1997 año
6.078
-0.129
-2.08%
1 ene 1998 año
5.367
-0.71
-11.68%
1 ene 1999 año
7.297
+1.929
35.95%
1 ene 2000 año
6.729
-0.568
-7.78%
1 ene 2001 año
2.209
-4.52
-67.17%
1 ene 2002 año
4.034
+1.825
82.6%
1 ene 2003 año
3.478
-0.556
-13.78%
1 ene 2004 año
7.855
+4.377
125.86%
1 ene 2005 año
6.782
-1.073
-13.66%
1 ene 2006 año
8.184
+1.402
20.67%
1 ene 2007 año
7.828
-0.356
-4.35%
1 ene 2008 año
10.582
+2.754
35.18%
1 ene 2009 año
2.293
-8.289
-78.33%
1 ene 2010 año
10.982
+8.689
378.93%
1 ene 2011 año
7.82
-3.161
-28.79%
1 ene 2012 año
3.822
-3.999
-51.13%
1 ene 2013 año
5.213
+1.391
36.39%
1 ene 2014 año
5.934
+0.721
13.83%
1 ene 2015 año
6.991
+1.057
17.81%
Ranking de los países por los datos estadísticos actuales


Comentarios: