29
/es/
es
AIzaSyAYiBZKx7MnpbEhh9jyipgxe19OcubqV5w
April 1, 2024
110528
Congo, Rep.
COG
true
2
1
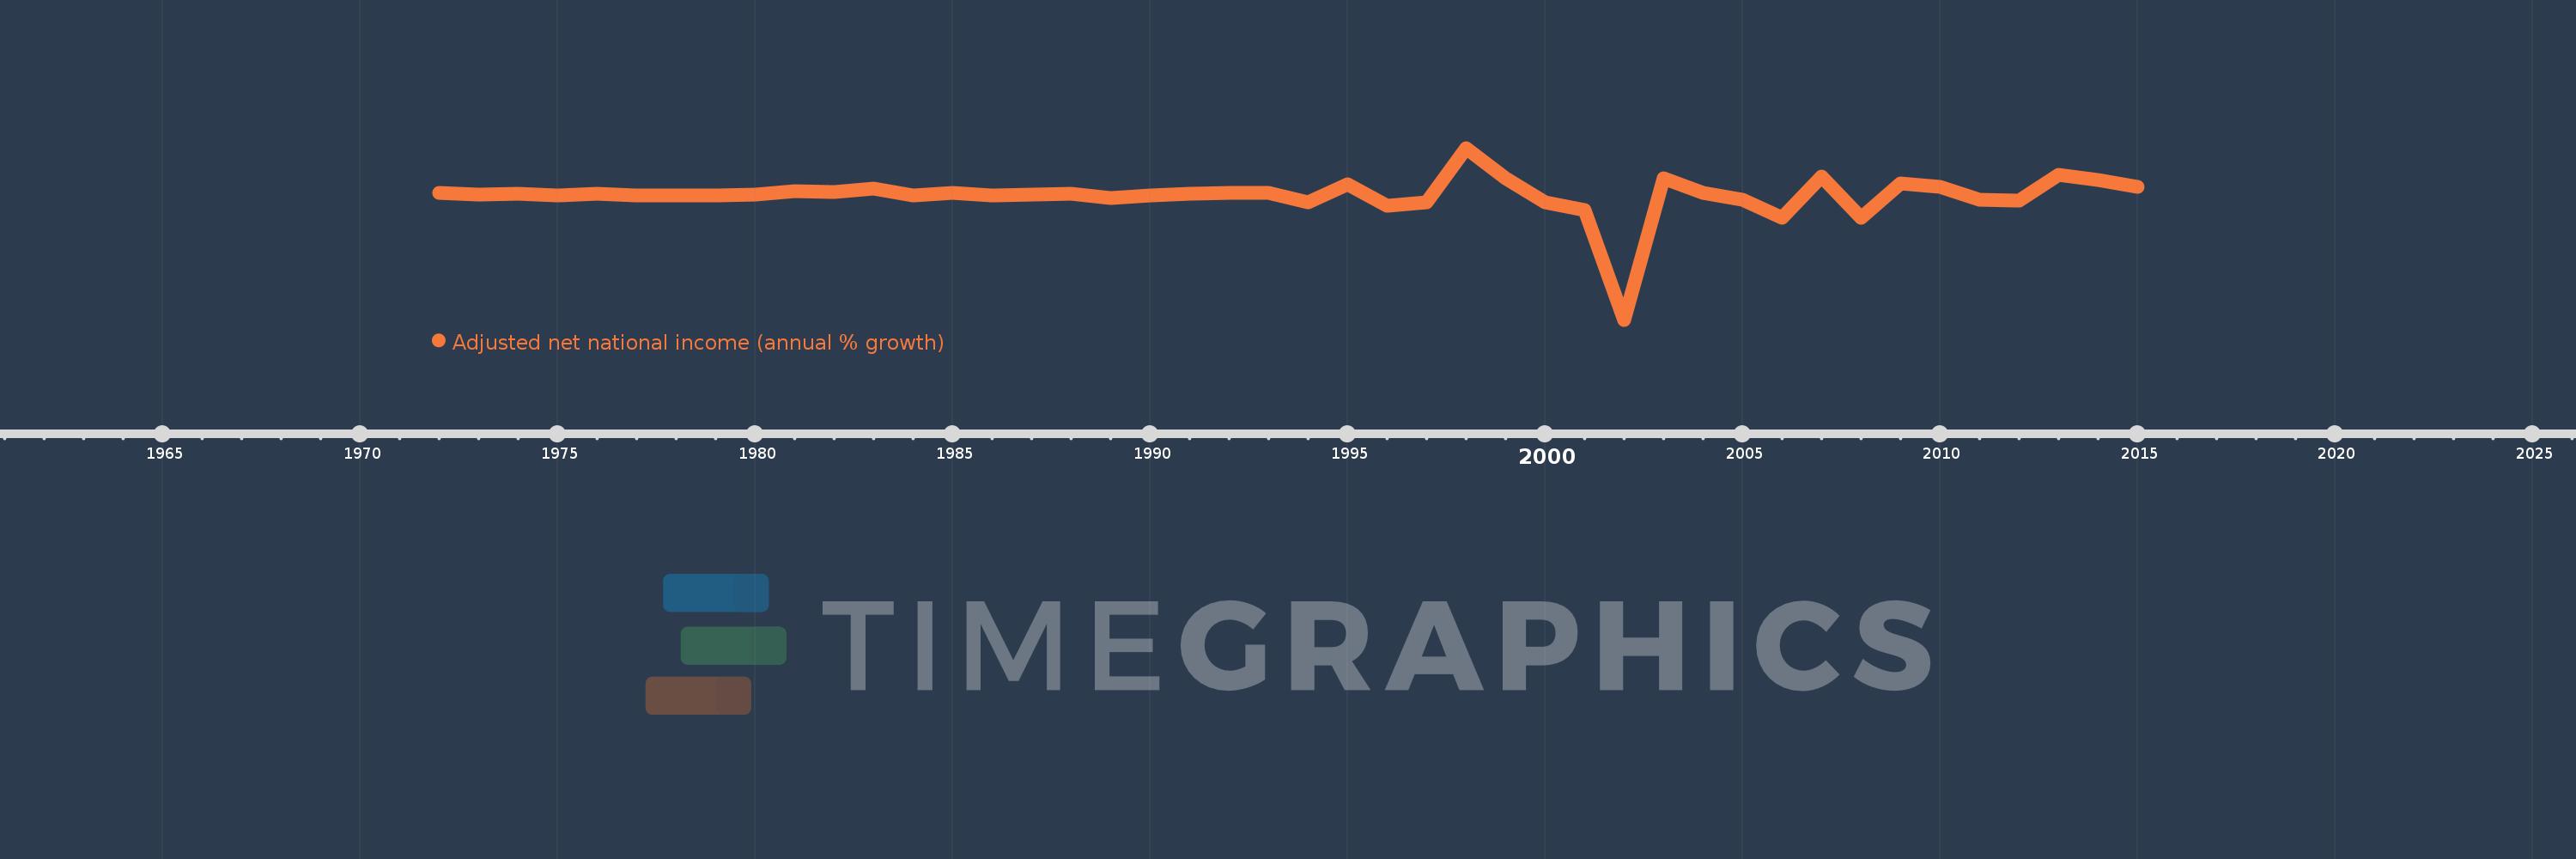
Adjusted net national income (annual % growth)
2015,2014,2013,2012,2011,2010,2009,2008,2007,2006,2005,2004,2003,2002,2001,2000,1999,1998,1997,1996,1995,1994,1993,1992,1991,1990,1989,1988,1987,1986,1985,1984,1983,1982,1981,1980,1979,1978,1977,1976,1975,1974,1973,1972
Estas estadísticas en otros países:
línea de tiempo (timeline):
En esta escala de tiempo se presenta un gráfico de 1972 y 2015 de Congo, Rep.. Los datos de 1971 están ausentes. El número de observaciones reales por fecha: 44.
Fuente (nombre):
Indicadores del desarrollo mundial
Fuente (organización):
World Bank staff estimates based on sources and methods in World Bank's "The Changing Wealth of Nations: Measuring Sustainable Development in the New Millennium" (2011).
Categorías:
Economy & Growth
Se ha actualizado:
23 abr 2017 año
Los indicadores de los cambios de valor en los últimos años
Mínimo:
-884.698
1 ene 2002 año
Máximo:
327.59
1 ene 1998 año
A la fecha de observación
Valor
Cambio absoluto
El cambio con respecto al valor anterior
1 ene 1972 año
7.939
+7.939
0.0%
1 ene 1973 año
0.746
-7.194
-90.61%
1 ene 1974 año
7.356
+6.611
886.51%
1 ene 1975 año
-8.227
-15.583
-211.84%
1 ene 1976 año
2.835
+11.062
-134.46%
1 ene 1977 año
-5.872
-8.707
-307.09%
1 ene 1978 año
-8.508
-2.637
44.91%
1 ene 1979 año
-5.239
+3.269
-38.42%
1 ene 1980 año
-4.529
+0.71
-13.56%
1 ene 1981 año
20.611
+25.14
-555.07%
1 ene 1982 año
18.747
-1.864
-9.04%
1 ene 1983 año
42.1
+23.353
124.57%
1 ene 1984 año
-8.333
-50.432
-119.79%
1 ene 1985 año
7.77
+16.103
-193.25%
1 ene 1986 año
-6.371
-14.141
-181.99%
1 ene 1987 año
1.232
+7.603
-119.34%
1 ene 1988 año
2.734
+1.502
121.88%
1 ene 1989 año
-26.384
-29.119
-1.07 mil%
1 ene 1990 año
-7.892
+18.493
-70.09%
1 ene 1991 año
3.806
+11.697
-148.22%
1 ene 1992 año
12.543
+8.737
229.58%
1 ene 1993 año
12.411
-0.131
-1.05%
1 ene 1994 año
-53.981
-66.392
-534.93%
1 ene 1995 año
71.226
+125.206
-231.95%
1 ene 1996 año
-79.682
-150.908
-211.87%
1 ene 1997 año
-58.522
+21.161
-26.56%
1 ene 1998 año
327.59
+386.112
-659.78%
1 ene 1999 año
112.067
-215.523
-65.79%
1 ene 2000 año
-55.239
-167.306
-149.29%
1 ene 2001 año
-110.608
-55.37
100.24%
1 ene 2002 año
-884.698
-774.09
699.85%
1 ene 2003 año
112.597
+997.295
-112.73%
1 ene 2004 año
12.548
-100.049
-88.86%
1 ene 2005 año
-37.4
-49.948
-398.06%
1 ene 2006 año
-163.253
-125.852
336.5%
1 ene 2007 año
123.761
+287.014
-175.81%
1 ene 2008 año
-167.112
-290.873
-235.03%
1 ene 2009 año
77.43
+244.542
-146.33%
1 ene 2010 año
53.121
-24.309
-31.4%
1 ene 2011 año
-40.056
-93.177
-175.41%
1 ene 2012 año
-43.152
-3.096
7.73%
1 ene 2013 año
138.714
+181.866
-421.46%
1 ene 2014 año
102.557
-36.157
-26.07%
1 ene 2015 año
54.005
-48.552
-47.34%
Ranking de los países por los datos estadísticos actuales


Comentarios: