29
/es/
es
AIzaSyAYiBZKx7MnpbEhh9jyipgxe19OcubqV5w
April 1, 2024
77788
Bangladesh
BGD
true
2
1
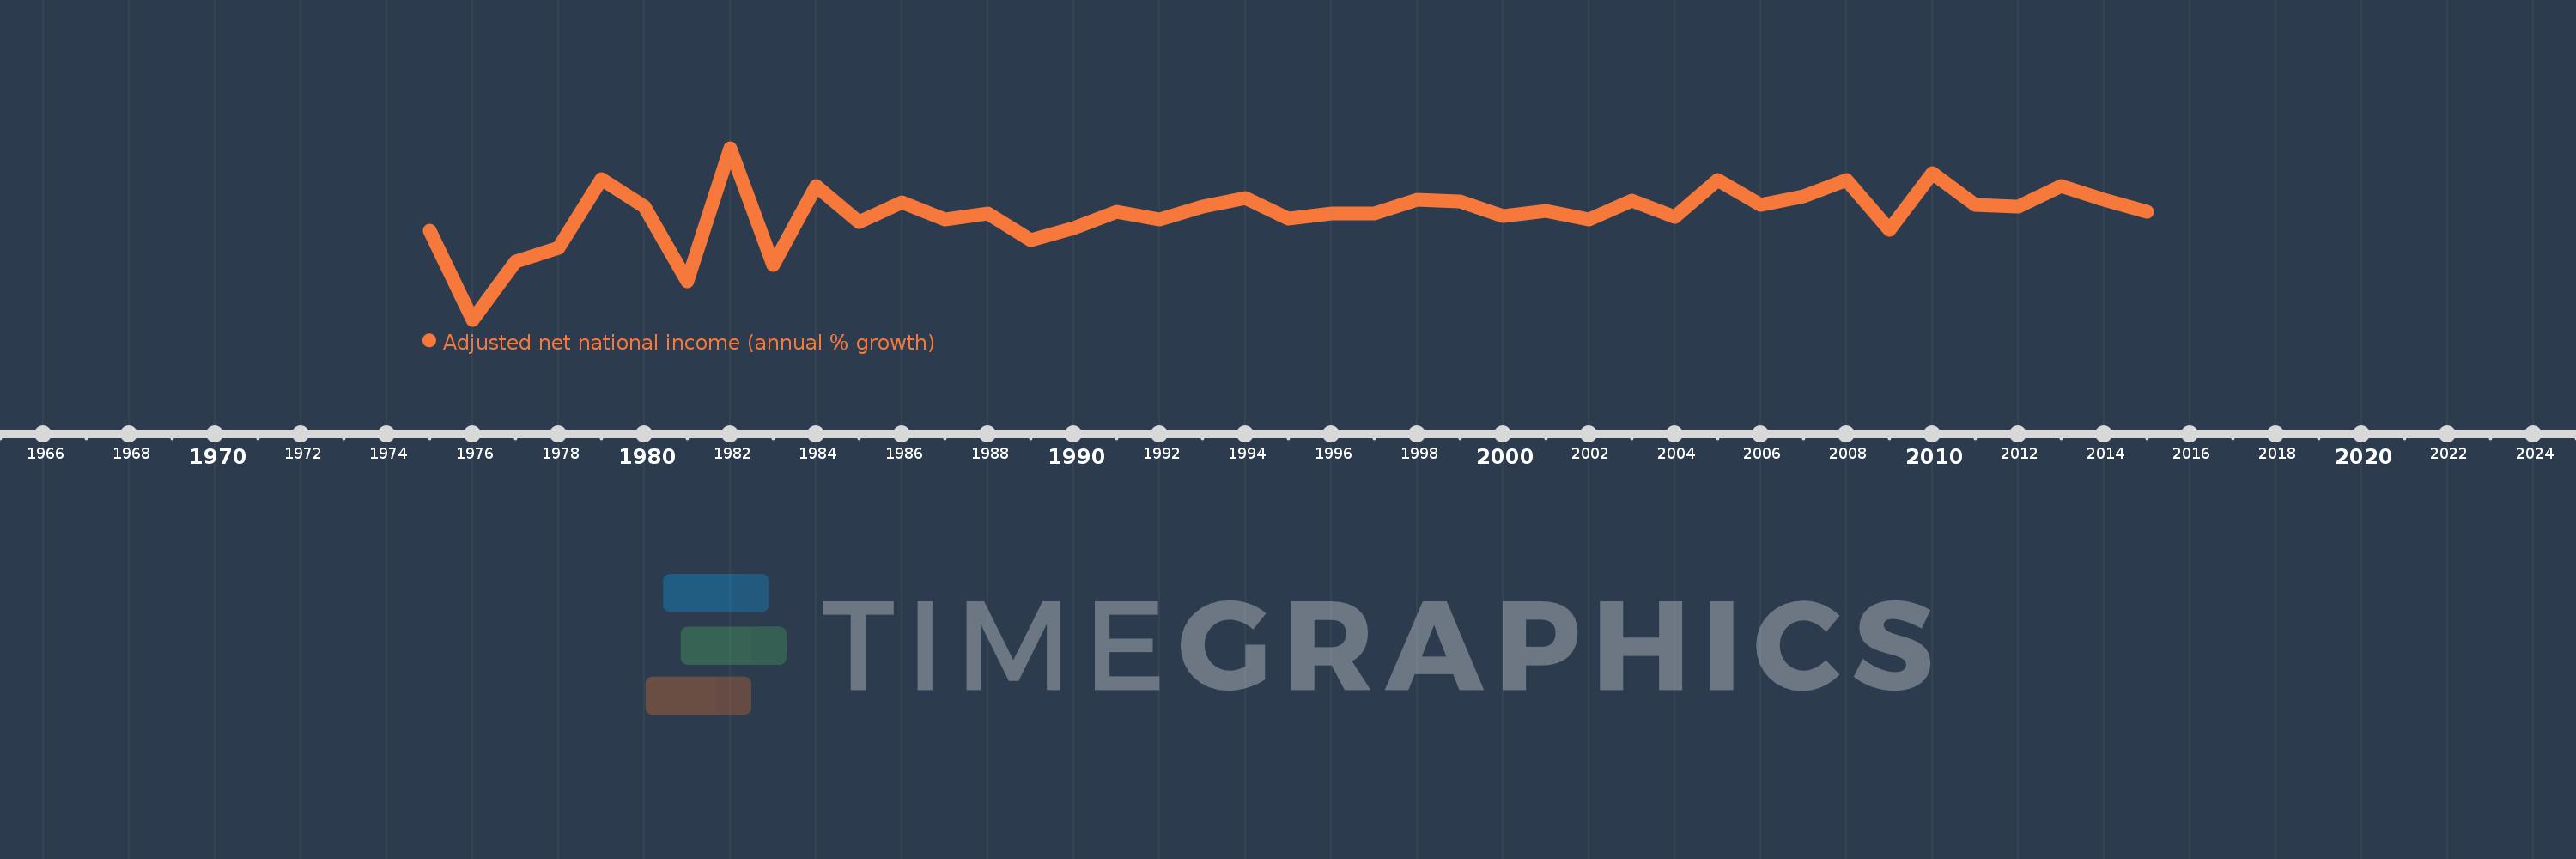
Adjusted net national income (annual % growth)
2015,2014,2013,2012,2011,2010,2009,2008,2007,2006,2005,2004,2003,2002,2001,2000,1999,1998,1997,1996,1995,1994,1993,1992,1991,1990,1989,1988,1987,1986,1985,1984,1983,1982,1981,1980,1979,1978,1977,1976,1975
Estas estadísticas en otros países:
línea de tiempo (timeline):
En esta escala de tiempo se presenta un gráfico de 1975 y 2015 de Bangladesh. Los datos de 1974 están ausentes. El número de observaciones reales por fecha: 41.
Fuente (nombre):
Indicadores del desarrollo mundial
Fuente (organización):
World Bank staff estimates based on sources and methods in World Bank's "The Changing Wealth of Nations: Measuring Sustainable Development in the New Millennium" (2011).
Categorías:
Economy & Growth
Se ha actualizado:
23 abr 2017 año
Los indicadores de los cambios de valor en los últimos años
Mínimo:
-5.508
1 ene 1976 año
Máximo:
10.885
1 ene 1982 año
A la fecha de observación
Valor
Cambio absoluto
El cambio con respecto al valor anterior
1 ene 1975 año
2.958
+2.958
0.0%
1 ene 1976 año
-5.508
-8.466
-286.21%
1 ene 1977 año
0.04
+5.548
-100.72%
1 ene 1978 año
1.342
+1.302
3.27 mil%
1 ene 1979 año
7.898
+6.556
488.7%
1 ene 1980 año
5.285
-2.612
-33.08%
1 ene 1981 año
-1.823
-7.109
-134.5%
1 ene 1982 año
10.885
+12.708
-696.93%
1 ene 1983 año
-0.255
-11.14
-102.34%
1 ene 1984 año
7.271
+7.526
-2.95 mil%
1 ene 1985 año
3.85
-3.421
-47.05%
1 ene 1986 año
5.677
+1.828
47.47%
1 ene 1987 año
4.046
-1.631
-28.73%
1 ene 1988 año
4.622
+0.576
14.24%
1 ene 1989 año
2.109
-2.513
-54.37%
1 ene 1990 año
3.216
+1.107
52.48%
1 ene 1991 año
4.828
+1.612
50.13%
1 ene 1992 año
4.09
-0.738
-15.29%
1 ene 1993 año
5.309
+1.219
29.81%
1 ene 1994 año
6.144
+0.835
15.73%
1 ene 1995 año
4.134
-2.01
-32.71%
1 ene 1996 año
4.648
+0.514
12.43%
1 ene 1997 año
4.601
-0.047
-1.01%
1 ene 1998 año
5.958
+1.357
29.49%
1 ene 1999 año
5.804
-0.153
-2.57%
1 ene 2000 año
4.402
-1.402
-24.16%
1 ene 2001 año
4.888
+0.486
11.05%
1 ene 2002 año
4.088
-0.801
-16.38%
1 ene 2003 año
5.888
+1.8
44.04%
1 ene 2004 año
4.292
-1.596
-27.11%
1 ene 2005 año
7.832
+3.54
82.48%
1 ene 2006 año
5.413
-2.419
-30.89%
1 ene 2007 año
6.233
+0.821
15.16%
1 ene 2008 año
7.789
+1.556
24.96%
1 ene 2009 año
3.094
-4.695
-60.27%
1 ene 2010 año
8.499
+5.405
174.66%
1 ene 2011 año
5.431
-3.068
-36.1%
1 ene 2012 año
5.318
-0.113
-2.07%
1 ene 2013 año
7.247
+1.929
36.28%
1 ene 2014 año
5.918
-1.33
-18.35%
1 ene 2015 año
4.821
-1.097
-18.54%
Ranking de los países por los datos estadísticos actuales


Comentarios: