29
/es/
es
AIzaSyAYiBZKx7MnpbEhh9jyipgxe19OcubqV5w
April 1, 2024
125732
El Salvador
SLV
true
2
1
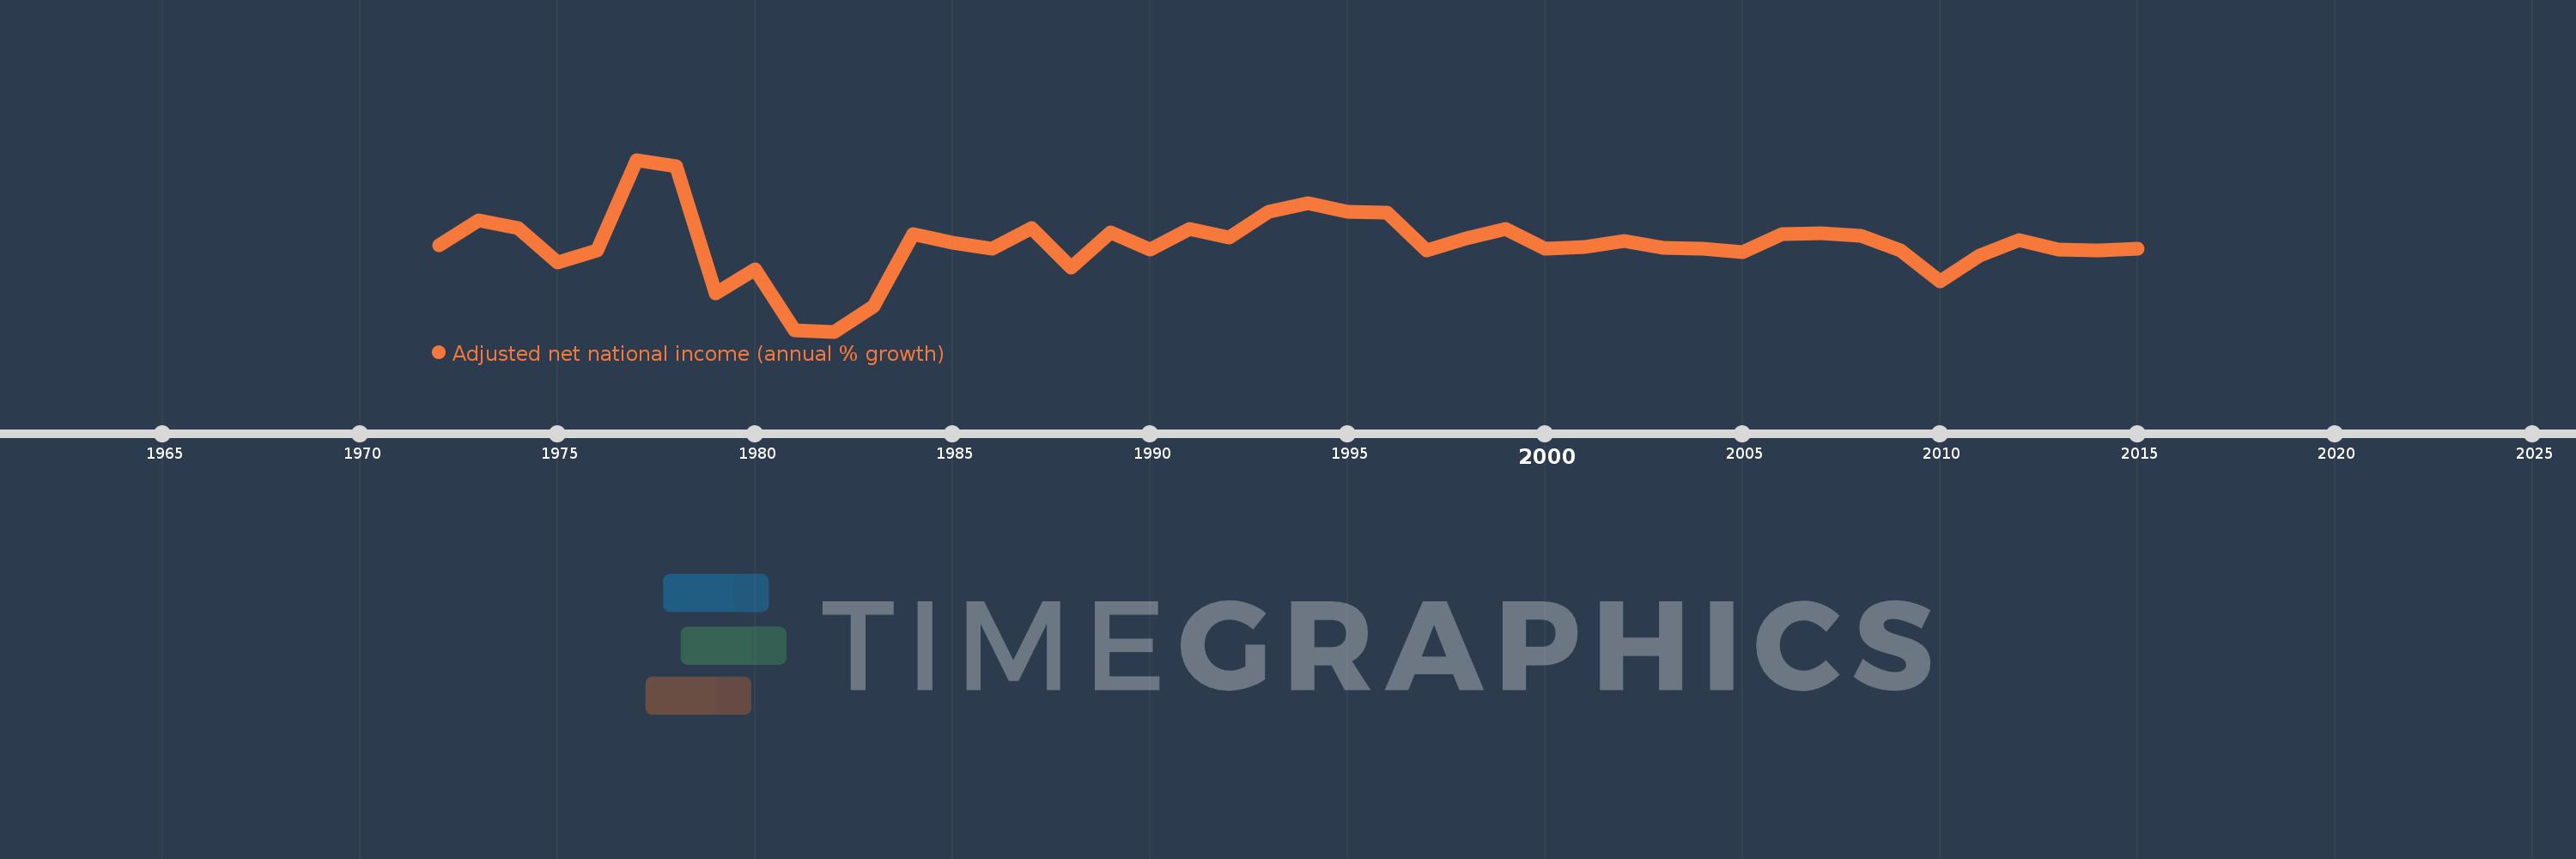
Adjusted net national income (annual % growth)
2015,2014,2013,2012,2011,2010,2009,2008,2007,2006,2005,2004,2003,2002,2001,2000,1999,1998,1997,1996,1995,1994,1993,1992,1991,1990,1989,1988,1987,1986,1985,1984,1983,1982,1981,1980,1979,1978,1977,1976,1975,1974,1973,1972
Estas estadísticas en otros países:
línea de tiempo (timeline):
En esta escala de tiempo se presenta un gráfico de 1972 y 2015 de El Salvador. Los datos de 1971 están ausentes. El número de observaciones reales por fecha: 44.
Fuente (nombre):
Indicadores del desarrollo mundial
Fuente (organización):
World Bank staff estimates based on sources and methods in World Bank's "The Changing Wealth of Nations: Measuring Sustainable Development in the New Millennium" (2011).
Categorías:
Economy & Growth
Se ha actualizado:
23 abr 2017 año
Los indicadores de los cambios de valor en los últimos años
Mínimo:
-15.865
1 ene 1982 año
Máximo:
19.394
1 ene 1977 año
A la fecha de observación
Valor
Cambio absoluto
El cambio con respecto al valor anterior
1 ene 1972 año
1.914
+1.914
0.0%
1 ene 1973 año
6.942
+5.028
262.71%
1 ene 1974 año
5.366
-1.577
-22.71%
1 ene 1975 año
-1.67
-7.035
-131.12%
1 ene 1976 año
0.818
+2.487
-148.98%
1 ene 1977 año
19.394
+18.576
2.27 mil%
1 ene 1978 año
18.11
-1.284
-6.62%
1 ene 1979 año
-7.991
-26.1
-144.12%
1 ene 1980 año
-3.133
+4.858
-60.8%
1 ene 1981 año
-15.628
-12.495
398.88%
1 ene 1982 año
-15.865
-0.237
1.52%
1 ene 1983 año
-10.635
+5.23
-32.96%
1 ene 1984 año
4.096
+14.731
-138.51%
1 ene 1985 año
2.464
-1.632
-39.84%
1 ene 1986 año
1.148
-1.316
-53.41%
1 ene 1987 año
5.431
+4.283
373.14%
1 ene 1988 año
-2.667
-8.098
-149.1%
1 ene 1989 año
4.56
+7.227
-271.0%
1 ene 1990 año
0.889
-3.671
-80.5%
1 ene 1991 año
5.133
+4.244
477.26%
1 ene 1992 año
3.525
-1.608
-31.33%
1 ene 1993 año
8.767
+5.242
148.7%
1 ene 1994 año
10.445
+1.678
19.14%
1 ene 1995 año
8.707
-1.738
-16.64%
1 ene 1996 año
8.588
-0.119
-1.36%
1 ene 1997 año
0.82
-7.768
-90.45%
1 ene 1998 año
3.327
+2.507
305.84%
1 ene 1999 año
5.285
+1.958
58.85%
1 ene 2000 año
1.182
-4.103
-77.64%
1 ene 2001 año
1.547
+0.365
30.84%
1 ene 2002 año
2.763
+1.216
78.64%
1 ene 2003 año
1.379
-1.384
-50.09%
1 ene 2004 año
1.165
-0.214
-15.49%
1 ene 2005 año
0.381
-0.785
-67.33%
1 ene 2006 año
4.092
+3.711
974.91%
1 ene 2007 año
4.396
+0.304
7.43%
1 ene 2008 año
3.845
-0.552
-12.55%
1 ene 2009 año
0.769
-3.076
-80.01%
1 ene 2010 año
-5.631
-6.4
-832.6%
1 ene 2011 año
-0.35
+5.281
-93.78%
1 ene 2012 año
2.921
+3.272
-933.74%
1 ene 2013 año
0.989
-1.932
-66.14%
1 ene 2014 año
0.741
-0.249
-25.13%
1 ene 2015 año
1.138
+0.397
53.63%
Ranking de los países por los datos estadísticos actuales


Comentarios: