29
/es/
es
AIzaSyAYiBZKx7MnpbEhh9jyipgxe19OcubqV5w
April 1, 2024
135147
Gabon
GAB
true
2
1
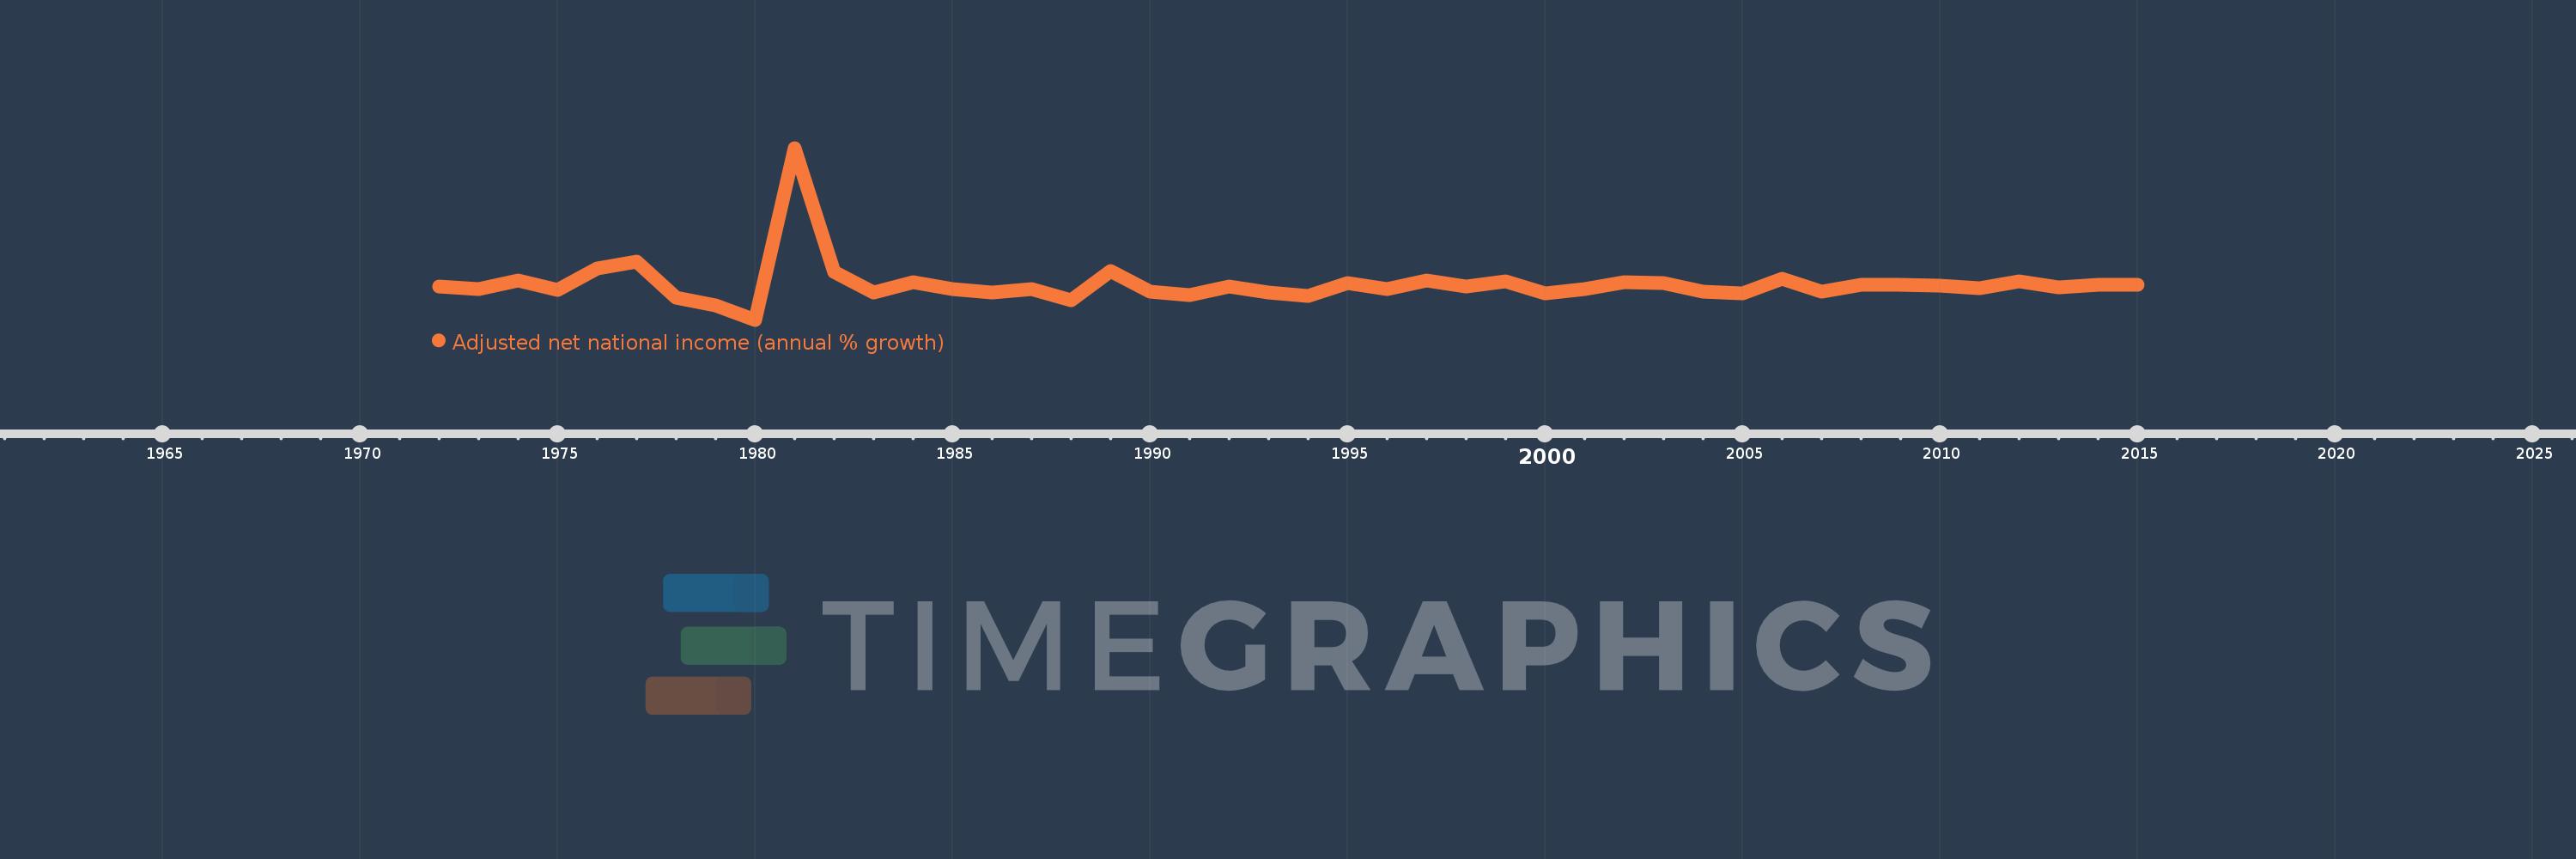
Adjusted net national income (annual % growth)
2015,2014,2013,2012,2011,2010,2009,2008,2007,2006,2005,2004,2003,2002,2001,2000,1999,1998,1997,1996,1995,1994,1993,1992,1991,1990,1989,1988,1987,1986,1985,1984,1983,1982,1981,1980,1979,1978,1977,1976,1975,1974,1973,1972
Estas estadísticas en otros países:
línea de tiempo (timeline):
En esta escala de tiempo se presenta un gráfico de 1972 y 2015 de Gabon. Los datos de 1971 están ausentes. El número de observaciones reales por fecha: 44.
Fuente (nombre):
Indicadores del desarrollo mundial
Fuente (organización):
World Bank staff estimates based on sources and methods in World Bank's "The Changing Wealth of Nations: Measuring Sustainable Development in the New Millennium" (2011).
Categorías:
Economy & Growth
Se ha actualizado:
23 abr 2017 año
Los indicadores de los cambios de valor en los últimos años
Mínimo:
-69.775
1 ene 1980 año
Máximo:
316.069
1 ene 1981 año
A la fecha de observación
Valor
Cambio absoluto
El cambio con respecto al valor anterior
1 ene 1972 año
4.154
+4.154
0.0%
1 ene 1973 año
-1.44
-5.594
-134.66%
1 ene 1974 año
18.903
+20.342
-1.41 mil%
1 ene 1975 año
-2.809
-21.712
-114.86%
1 ene 1976 año
45.708
+48.517
-1.73 mil%
1 ene 1977 año
61.658
+15.951
34.9%
1 ene 1978 año
-19.377
-81.036
-131.43%
1 ene 1979 año
-38.273
-18.896
97.52%
1 ene 1980 año
-69.775
-31.502
82.31%
1 ene 1981 año
316.069
+385.844
-552.99%
1 ene 1982 año
37.13
-278.94
-88.25%
1 ene 1983 año
-8.25
-45.38
-122.22%
1 ene 1984 año
13.952
+22.202
-269.11%
1 ene 1985 año
-1.113
-15.065
-107.98%
1 ene 1986 año
-8.476
-7.363
661.54%
1 ene 1987 año
-0.303
+8.174
-96.43%
1 ene 1988 año
-26.576
-26.273
8.68 mil%
1 ene 1989 año
40.007
+66.582
-250.54%
1 ene 1990 año
-6.529
-46.536
-116.32%
1 ene 1991 año
-14.632
-8.102
124.08%
1 ene 1992 año
4.232
+18.863
-128.92%
1 ene 1993 año
-8.709
-12.941
-305.82%
1 ene 1994 año
-15.436
-6.727
77.24%
1 ene 1995 año
13.16
+28.596
-185.25%
1 ene 1996 año
-0.737
-13.896
-105.6%
1 ene 1997 año
18.4
+19.137
-2.6 mil%
1 ene 1998 año
4.609
-13.791
-74.95%
1 ene 1999 año
17.118
+12.509
271.42%
1 ene 2000 año
-9.792
-26.91
-157.2%
1 ene 2001 año
-0.281
+9.511
-97.14%
1 ene 2002 año
14.795
+15.076
-5.37 mil%
1 ene 2003 año
12.007
-2.789
-18.85%
1 ene 2004 año
-6.0
-18.006
-149.97%
1 ene 2005 año
-9.675
-3.675
61.25%
1 ene 2006 año
22.58
+32.254
-333.39%
1 ene 2007 año
-6.797
-29.377
-130.1%
1 ene 2008 año
8.539
+15.336
-225.63%
1 ene 2009 año
8.434
-0.105
-1.23%
1 ene 2010 año
6.224
-2.209
-26.2%
1 ene 2011 año
1.15
-5.074
-81.52%
1 ene 2012 año
16.571
+15.42
1.34 mil%
1 ene 2013 año
3.092
-13.478
-81.34%
1 ene 2014 año
8.06
+4.967
160.63%
1 ene 2015 año
8.91
+0.851
10.55%
Ranking de los países por los datos estadísticos actuales


Comentarios: