29
/es/
es
AIzaSyAYiBZKx7MnpbEhh9jyipgxe19OcubqV5w
April 1, 2024
116574
Cyprus
CYP
true
2
1
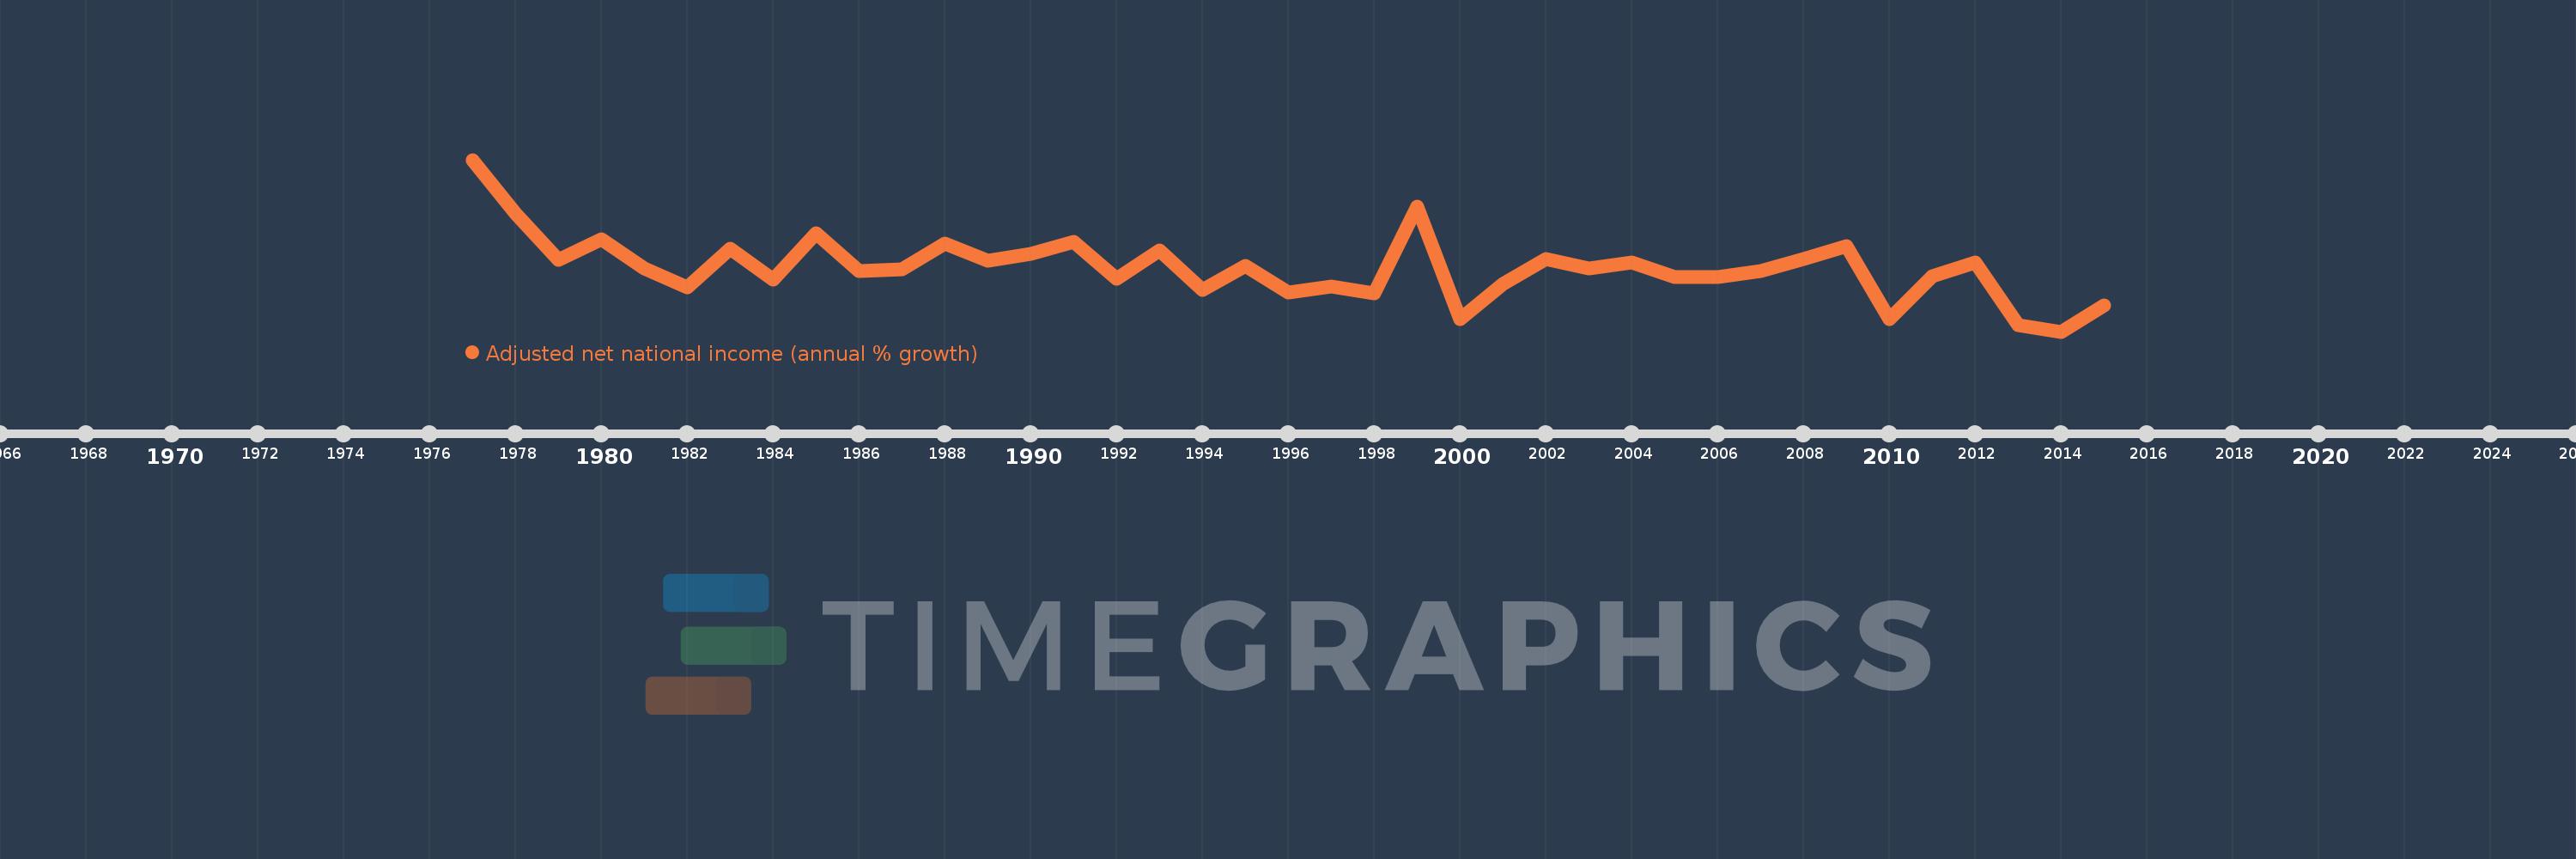
Adjusted net national income (annual % growth)
2015,2014,2013,2012,2011,2010,2009,2008,2007,2006,2005,2004,2003,2002,2001,2000,1999,1998,1997,1996,1995,1994,1993,1992,1991,1990,1989,1988,1987,1986,1985,1984,1983,1982,1981,1980,1979,1978,1977
Estas estadísticas en otros países:
línea de tiempo (timeline):
En esta escala de tiempo se presenta un gráfico de 1977 y 2015 de Cyprus. Los datos de 1976 están ausentes. El número de observaciones reales por fecha: 39.
Fuente (nombre):
Indicadores del desarrollo mundial
Fuente (organización):
World Bank staff estimates based on sources and methods in World Bank's "The Changing Wealth of Nations: Measuring Sustainable Development in the New Millennium" (2011).
Categorías:
Economy & Growth
Se ha actualizado:
23 abr 2017 año
Los indicadores de los cambios de valor en los últimos años
Mínimo:
-7.794
1 ene 2014 año
Máximo:
25.754
1 ene 1977 año
A la fecha de observación
Valor
Cambio absoluto
El cambio con respecto al valor anterior
1 ene 1977 año
25.754
+25.754
0.0%
1 ene 1978 año
15.215
-10.539
-40.92%
1 ene 1979 año
6.219
-8.996
-59.13%
1 ene 1980 año
10.158
+3.939
63.33%
1 ene 1981 año
4.609
-5.549
-54.62%
1 ene 1982 año
0.835
-3.774
-81.88%
1 ene 1983 año
8.423
+7.587
908.35%
1 ene 1984 año
2.382
-6.041
-71.72%
1 ene 1985 año
11.448
+9.066
380.6%
1 ene 1986 año
4.107
-7.341
-64.12%
1 ene 1987 año
4.379
+0.271
6.61%
1 ene 1988 año
9.402
+5.023
114.72%
1 ene 1989 año
6.128
-3.275
-34.83%
1 ene 1990 año
7.419
+1.291
21.07%
1 ene 1991 año
9.653
+2.234
30.12%
1 ene 1992 año
2.45
-7.203
-74.62%
1 ene 1993 año
8.079
+5.63
229.83%
1 ene 1994 año
0.32
-7.759
-96.03%
1 ene 1995 año
5.03
+4.71
1.47 mil%
1 ene 1996 año
-0.127
-5.157
-102.53%
1 ene 1997 año
1.015
+1.142
-897.53%
1 ene 1998 año
-0.363
-1.378
-135.82%
1 ene 1999 año
16.676
+17.04
-4.69 mil%
1 ene 2000 año
-5.37
-22.047
-132.2%
1 ene 2001 año
1.475
+6.845
-127.46%
1 ene 2002 año
6.445
+4.971
337.12%
1 ene 2003 año
4.505
-1.94
-30.1%
1 ene 2004 año
5.776
+1.271
28.22%
1 ene 2005 año
2.776
-3.001
-51.95%
1 ene 2006 año
2.795
+0.019
0.69%
1 ene 2007 año
3.955
+1.16
41.51%
1 ene 2008 año
6.312
+2.357
59.58%
1 ene 2009 año
8.88
+2.568
40.69%
1 ene 2010 año
-5.436
-14.316
-161.22%
1 ene 2011 año
2.982
+8.419
-154.86%
1 ene 2012 año
5.67
+2.688
90.13%
1 ene 2013 año
-6.513
-12.183
-214.86%
1 ene 2014 año
-7.794
-1.281
19.66%
1 ene 2015 año
-2.646
+5.148
-66.05%
Ranking de los países por los datos estadísticos actuales


Comentarios: